

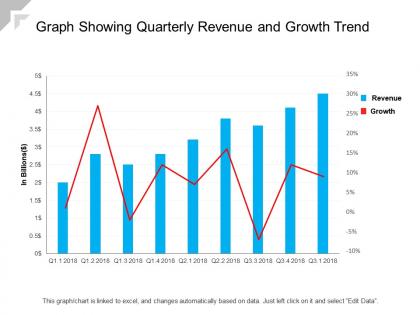
Graph showing quarterly revenue and growth trend




Try Before you Buy Download Free Sample Product
 Impress Your
 Audience
 100%
100% Editable
 Save Hours
 of Time


Our Graph Showing Quarterly Revenue And Growth Trend allow for intelligent innovations. You will come up with inspired designs.
People who downloaded this PowerPoint presentation also viewed the following :
Graph showing quarterly revenue and growth trend with all 6 slides:
You will come up with inspired designs due to our Graph Showing Quarterly Revenue And Growth Trend. It allows for intelligent innovations.




FAQs for Graph showing quarterly revenue
Key indicators include year-over-year revenue comparisons, customer acquisition rates, average transaction values, market share expansion, and recurring revenue streams. These metrics vary significantly across sectors, with retail focusing on same-store sales growth, technology companies emphasizing subscription renewals, and manufacturing tracking order backlogs, ultimately delivering comprehensive performance insights for strategic decision-making.
Companies can effectively forecast quarterly revenue growth by analyzing historical trends, seasonal patterns, customer acquisition rates, market conditions, and pipeline data through statistical models and predictive analytics. By combining regression analysis with machine learning algorithms, businesses streamline forecasting accuracy, identify growth opportunities, and adjust strategies proactively, ultimately delivering more reliable financial planning and competitive advantage.
Content marketing, email campaigns, social media advertising, strategic partnerships, and customer retention programs have proven most effective in driving quarterly revenue growth. These strategies enhance brand visibility, nurture leads through targeted messaging, and maximize customer lifetime value, with many organizations finding that integrated approaches combining digital outreach with retention initiatives ultimately deliver sustained revenue increases and competitive market positioning.
Seasonal trends significantly impact quarterly revenue growth through consumer behavior shifts, weather patterns, and industry-specific cycles, with retail experiencing peak Q4 performance, tourism fluctuating by destination seasons, and agriculture following harvest schedules. These patterns enable strategic resource allocation and inventory management, with many organizations finding that anticipating seasonal variations enhances forecasting accuracy and ultimately delivers more consistent annual performance.
Customer feedback drives quarterly revenue growth by identifying service gaps, revealing upselling opportunities, improving product development, and enhancing customer retention strategies. Through systematic feedback analysis, organizations streamline their offerings, reduce churn rates, and accelerate cross-selling initiatives, with many retail and financial services companies finding that customer-driven improvements ultimately deliver higher satisfaction scores and measurable revenue increases.
Companies can leverage business intelligence platforms, automated reporting systems, real-time analytics dashboards, CRM integration tools, and predictive forecasting software to enhance quarterly revenue tracking. These technologies streamline data collection, minimize manual errors, and deliver instant visibility into revenue trends, with many organizations finding that automated tracking enables faster decision-making and more accurate growth projections.
Common pitfalls include over-discounting to boost short-term sales, neglecting customer retention for new acquisition, cutting essential marketing spend, and prioritizing quantity over quality leads. While these approaches may deliver immediate results, they often undermine long-term profitability and customer relationships, with many organizations finding that sustainable growth requires balanced strategies emphasizing both revenue acceleration and operational efficiency.
Startups can measure quarterly revenue growth through revenue per customer metrics, customer acquisition costs, market share analysis, and cohort retention tracking. By diversifying revenue streams, optimizing pricing strategies, and enhancing customer experiences, many startups find that consistent measurement combined with agile adaptation enables sustained growth while building competitive advantages in increasingly crowded markets.
External economic factors significantly impact quarterly revenue growth through inflation rates, interest rate fluctuations, consumer spending patterns, currency exchange rates, and market volatility. These macroeconomic conditions influence customer purchasing power, operational costs, and investment decisions, with many organizations finding that strategic planning and diversified revenue streams help mitigate risks while capitalizing on emerging opportunities.
Businesses can align operational strategies with quarterly revenue growth by streamlining processes, optimizing resource allocation, enhancing customer experiences, and implementing data-driven decision making. Through strategic automation and performance metrics, organizations accelerate service delivery, reduce operational costs, and improve market responsiveness, with many companies finding that integrated approaches ultimately deliver sustained competitive advantage and measurable financial outcomes.
Financial models for predicting quarterly revenue growth include time series analysis, regression models, cohort analysis, customer lifetime value projections, and seasonal decomposition methods. These approaches enhance forecasting accuracy by analyzing historical patterns, market variables, and customer behavior trends, with many organizations finding that combining multiple models delivers more reliable predictions and enables better resource allocation for sustained competitive advantage.
Customer retention influences quarterly revenue growth by reducing acquisition costs, increasing lifetime value, and generating predictable recurring revenue streams. Companies with strong retention strategies, like subscription services and financial institutions, often see 25-40% higher growth rates through upselling opportunities and referral generation, while minimizing revenue volatility and enhancing investor confidence.
**INPUT**: What metrics should be prioritized for a comprehensive analysis of quarterly revenue growth? **OUTPUT**: Key metrics include year-over-year growth rates, customer acquisition costs, average revenue per user, retention rates, and market share expansion across different segments. These indicators enable organizations to identify revenue drivers, optimize pricing strategies, and enhance customer lifetime value, with many companies finding that combining financial and operational metrics delivers deeper insights into sustainable growth patterns and competitive positioning. [Word count: 60 words]
Companies can leverage competitor analysis to inform quarterly revenue growth by examining competitors' pricing strategies, product launches, market positioning, customer acquisition tactics, and seasonal campaigns. Through comprehensive competitive intelligence, businesses can identify market gaps, optimize their own pricing models, and accelerate go-to-market strategies, ultimately delivering enhanced market share and revenue performance in an increasingly competitive landscape.
Aligning sales and marketing maximizes quarterly revenue growth by creating unified customer journeys, eliminating lead qualification gaps, and streamlining conversion processes from awareness to purchase. This strategic coordination enables faster deal cycles, higher-quality prospects, and improved forecast accuracy, with many organizations finding that aligned teams generate 20% more revenue annually while reducing customer acquisition costs.
No Reviews