

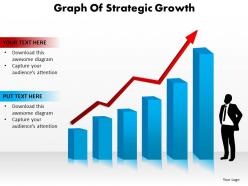
Graph of strategic growth





Try Before you Buy Download Free Sample Product
 Impress Your
Audience
 100%
Editable
 Save Hours
of Time


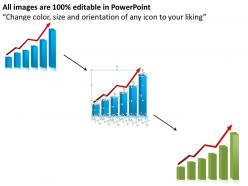
To depict the diverse business markers which will help you in imparting your business improvement then we have composed readymade PPT design on business progression named as graph of strategic growth PowerPoint arrange slide. You can use this PPT slide design rate circle information visual computerization to depict the alternate points of view which supports you in measuring the association progress, for instance, change in the level of the customer at risk to repurchase comparative things or organizations, extent of association bargains, level of advance in business salary or advantage. While the two essential import factors on which the advancement of your business depends are the idea of things and furthermore the purchaser devotion level. This graph of strategic growth PPT template slides will in like manner give you a standard instrument to describe or track the issue related with your business improvement like market competition, biological issues, and distinctive business internal or outside components. So hence just start presenting with this graph of strategic growth introduction format slide.Lead on with our Graph Of Strategic Growth. Let your team know thatyou are the chief.
People who downloaded this PowerPoint presentation also viewed the following :
Graph of strategic growth with all 5 slides:
If easy is the way you want to go. Our Graph Of Strategic Growth know the route.

FAQs for Graph
So you need your time periods first - quarterly works best IMO. Then pick your main growth numbers like revenue or users. Don't forget milestone markers for big launches or goals. Context lines are super helpful too, like showing where you started vs where you're trying to go. Oh, and factor in seasonal stuff or market weirdness that might mess with your numbers. The goal is making everything visual so people can actually follow the story. Start with maybe 2-3 key metrics and add more later - you don't want to overwhelm everyone right off the bat.
Line graphs are your best bet for growth stuff - revenue, users, whatever you're tracking. Bar charts work well if you're comparing different time periods. Keep it stupid simple though, because nobody wants to decode some confusing mess during a meeting. Clear labels are clutch, and stick to consistent time intervals. Trend lines help show direction too. Oh, and don't cram everything onto one chart - I've seen people do this and it's just visual chaos. Pick your most important metric first. Then make separate charts for the other stuff.
Look, market analysis is honestly your reality check before making any growth plans. Without it, you're basically guessing and hoping for the best - which never works out well. It shows you where you actually are vs where you think you are, plus what your competition is up to. You'll spot trends that could either boost your growth or totally derail it. The data helps you set targets that aren't completely unrealistic too. Oh, and definitely gather customer feedback and competitor info first - I learned that the hard way. Then you can actually build a growth strategy that makes sense.
Honestly, these graphs are like having a heads-up before everything goes sideways. You'll see where your growth curve starts to flatten way before it actually happens - super helpful for catching stuff like when customer costs suddenly spike or your team hits that "we're drowning" point. The visual thing makes it obvious where those "oh shit" moments are coming. Look for steep climbs that suddenly plateau out. Those spots? That's where your biggest headaches will probably hit. I know it sounds nerdy, but spotting these patterns early means you can actually do something about it instead of just scrambling later.
Look, focus on the basics first - revenue growth, customer acquisition cost, and lifetime value. If you're doing subscriptions, track monthly recurring revenue too. Churn rate is huge (learned that one the hard way). Market share's nice if you can actually get decent data on it, but don't stress if not. Honestly, most startups track way too much stuff. Pick maybe 5 metrics that actually matter for decisions. Update them regularly so you'll spot patterns. The goal is seeing how fast you're growing, whether you're acquiring customers efficiently, and if they stick around long enough to be profitable.
Honestly, dig into your old data and see what actually moved the needle versus what you *thought* would work. Pull up the last 2-3 years - revenue jumps, customer costs, seasonal stuff. Map it against the big moves you made. I'm always surprised how many "brilliant" strategies did basically nothing when you actually look back. The boring stuff that worked consistently? That's your gold mine. Double down on those while you test new things. It's wild how much we fool ourselves about what drives real growth.
Dude, you gotta automate your data sources - that's where you'll see the biggest jump in accuracy. Real-time APIs pull in financial data and customer metrics without you touching anything. Machine learning spots patterns you'd totally miss and gives way better forecasts than guessing. Dashboard tools like Tableau eliminate those annoying calculation mistakes too. I still use Excel for quick stuff, but honestly it feels so clunky now for serious growth tracking. Start with whatever data you're manually updating most - probably your sales numbers? Those predictive analytics will blow your mind once you get them running.
Look, your growth graph isn't some sacred document – treat it more like a GPS that reroutes when traffic hits. Markets shift constantly, so you've gotta reassess your assumptions and timelines regularly. Economic uncertainty? Pull back those aggressive targets. New opportunity pops up? Speed things up. I swear, so many companies get married to graphs that looked amazing six months ago but are totally disconnected from reality now. Review quarterly for sure, but honestly don't hesitate to pivot mid-quarter if the signals are screaming at you. Your graph should show where you're actually headed, not where you hoped you'd be back in January.
Don't cram everything onto one chart - stick to 3-4 metrics tops. I've seen so many people mess up their Y-axis scales, like starting at weird numbers to make tiny growth look massive. Super obvious and makes you look sketchy. Keep timeframes realistic too. If there's a random spike somewhere, explain what caused it or people will just get confused. Oh, and test it on someone first! Seriously, grab a coworker and see if they get your main point in like 5 seconds. Clean beats comprehensive every time.
Honestly, timing is everything with these growth graphs. Drop them right when you need to back up a big decision or prove you know what you're talking about. Show where you are now, where you're headed, and hit those milestones that actually matter to whoever's listening. Everyone goes crazy for that hockey stick curve - even if it's kinda wishful thinking lol. Just match your numbers to the room: revenue for money people, users for product folks, market share for the C-suite. Oh, and don't let the energy die after showing it - jump straight into what you need from them.
Honestly, just start with whatever your team already knows - Excel or Google Sheets work fine for basic stuff. Tableau's amazing if you want those fancy interactive dashboards that actually look professional. Power BI's solid too. I've used Canva before but the templates can be kinda obvious (you know that "made in Canva" look). PowerPoint works surprisingly well if you're decent at design. Lucidchart's good for flowcharts and process stuff. Really depends on your budget and how data-heavy you're going - don't overthink it at first.
Track your growth numbers against what competitors are doing - revenue growth, market share, customer acquisition, whatever matters most. Plot them on the same timeline and you'll spot patterns immediately. Honestly, it's kind of brutal sometimes seeing how your "decent" progress stacks up when a rival is crushing it. Make sure you're using the same timeframes and metrics though, otherwise it's pointless. The real value comes after - once you see where they're beating you, dig into their strategies. What are they investing in that you're not? Then tweak your approach accordingly.
So a flat growth graph means you've hit a plateau - not growing but not tanking either. Honestly, this is when most businesses get too comfortable and that's dangerous. Your competitors aren't just sitting around doing nothing, you know? I'd dig into whether it's just temporary market stuff or if your current approach has basically maxed out. While you've still got steady cash flow, that's the perfect time to try new things. Maybe diversify how you make money, find different markets, or innovate your products. Don't wait too long though - flat usually turns into decline if you just sit there.
Honestly, those growth graphs are game-changers for team decisions. You know how everyone zones out during spreadsheet reviews? Visual data fixes that completely. Your team can actually see what's trending up or down without squinting at numbers. Plus people align way faster when they're all staring at the same chart – weird how that works but it does. Spotting bottlenecks becomes obvious. Tracking goals gets simpler too. Next meeting, just throw your key metrics into some visual format. I'm telling you, the discussions will flow so much better. Way less "wait, what does this number mean again?"
Honestly, data by itself is just... bleh. Nobody cares about your growth graph until you give it a story. Like, "we were dying here, then this happened and boom - turnaround." People actually listen when there's a narrative thread connecting those peaks and dips. I've watched so many presentations bomb because they just threw numbers at people without context. Your audience needs to feel the journey, not just see the results. The "why" matters way more than showing off your fancy upward trend. Oh, and definitely lead with the story first - then your graph becomes proof instead of just more boring slides.
-
Excellent products for quick understanding.
-
Great product with effective design. Helped a lot in our corporate presentations. Easy to edit and stunning visuals.