Website Usage Analytics Report Dashboard To Track Performance

Rating:
80%
Website Usage Analytics Report Dashboard To Track Performance
Slide 1 of 7
Favourites Favourites

Try Before you Buy Download Free Sample Product

Audience Impress Your
Audience
Editable 100%
Editable
Time Save Hours
of Time
The Biggest Sale is ending soon in
0
0
:
0
0
:
0
0
Rating:
80%
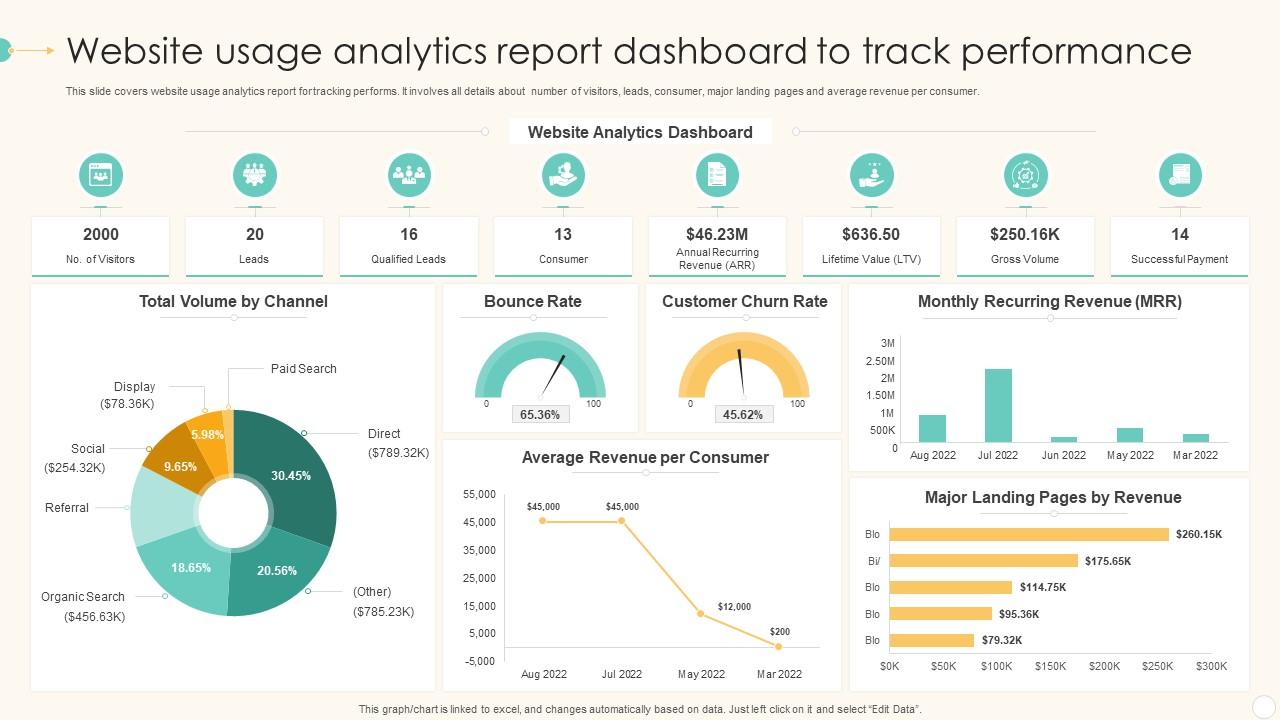
This slide covers website usage analytics report for tracking performs. It involves all details about number of visitors, leads, consumer, major landing pages and average revenue per consumer. Presenting our well-structured Website Usage Analytics Report Dashboard To Track Performance. The topics discussed in this slide are Website Analytics Report, Dashboard, Track Performance. This is an instantly available PowerPoint presentation that can be edited conveniently. Download it right away and captivate your audience.

FAQs for Website Usage Analytics Report Dashboard

Essential KPIs for website analytics dashboards include traffic volume, conversion rates, bounce rates, page load times, user engagement metrics, and revenue attribution. These indicators enable businesses to track customer behavior, optimize user experiences, and measure campaign effectiveness, with many e-commerce and service organizations finding that comprehensive KPI monitoring delivers improved conversion rates and strategic competitive advantage.

Analytics dashboard customization involves configuring key performance indicators, setting up custom metrics aligned with revenue targets, creating goal-specific widgets, and establishing automated reporting schedules that match your business cycles. Through strategic widget placement and personalized data visualization, organizations streamline decision-making processes, enhance operational efficiency, and ultimately deliver faster insights that drive competitive advantage in increasingly data-driven markets.

The most effective tools for tracking user behavior include Google Analytics, Hotjar, Mixpanel, Adobe Analytics, and Crazy Egg. These platforms enhance website optimization by monitoring user journeys, analyzing conversion funnels, and identifying engagement patterns, with many e-commerce and SaaS companies finding that comprehensive behavior tracking ultimately delivers improved user experiences and increased conversion rates.

Real-time data transforms website management by enabling immediate responses to traffic spikes, user behavior patterns, and performance issues, while facilitating instant content optimization and resource allocation decisions. Through live analytics dashboards, organizations can quickly identify trending pages, resolve technical problems, and capitalize on emerging opportunities, ultimately delivering enhanced user experiences and improved conversion rates across their digital platforms.

Conversion rate serves as a critical performance indicator within website analytics dashboards, measuring how effectively visitors complete desired actions like purchases, sign-ups, or downloads. This metric enables businesses to assess campaign effectiveness, identify optimization opportunities, and track revenue impact, with many e-commerce and service companies finding that conversion rate analysis directly correlates with strategic decision-making and competitive advantage.

Heatmaps enhance website analytics by revealing user behavior patterns through click tracking, scroll depth analysis, and attention mapping that traditional metrics can't capture. These visual tools complement standard analytics by identifying navigation bottlenecks, content engagement zones, and conversion barriers, enabling businesses to optimize page layouts, improve user experiences, and ultimately increase conversion rates.

On-site analytics track user behavior within your website through page views, bounce rates, conversion funnels, and session duration, while off-site analytics monitor external factors like social media mentions, backlink performance, referral traffic sources, and brand sentiment across digital platforms. Effective dashboards should display these metrics in separate but connected sections, with on-site data showing internal performance trends and off-site metrics revealing external reach and reputation, ultimately enabling businesses to understand both customer journey optimization and broader market positioning for comprehensive digital strategy decisions.

Mobile responsiveness is critical when analyzing website traffic, as mobile users now represent over half of all web traffic across most industries. Since user behavior, session duration, and conversion patterns differ significantly between desktop and mobile experiences, responsive design directly impacts key metrics like bounce rates, page load times, and revenue generation, with many e-commerce and service businesses finding that mobile optimization dramatically improves their overall analytics performance.

Effective dashboard design follows clear data hierarchy, consistent color schemes, intuitive navigation, and strategic white space utilization to avoid visual clutter. These practices enhance user experience by streamlining data interpretation, minimizing cognitive load, and enabling faster decision-making, with many organizations finding that well-designed dashboards significantly improve team productivity and strategic insights.

A comprehensive website analytics dashboard should integrate Google Analytics, social media metrics, email marketing data, CRM systems, and heat mapping tools. These data sources work together by providing visitor behavior insights, conversion tracking, and user experience analysis, with many organizations finding that this strategic combination delivers enhanced customer understanding, improved marketing ROI, and competitive advantage through data-driven decision making.

Website analytics dashboards reveal traffic sources through organic search, paid advertising, social media, direct visits, and referral links, enabling detailed performance analysis across channels. By examining conversion rates, user behavior patterns, and engagement metrics from each source, businesses can reallocate marketing budgets more strategically, optimize high-performing campaigns, and eliminate underperforming channels, ultimately delivering improved ROI and targeted customer acquisition.

Common mistakes include focusing solely on vanity metrics like page views instead of conversion rates, ignoring mobile versus desktop user behavior differences, and misinterpreting correlation as causation. Many businesses also overlook segmenting data by traffic sources, demographics, and user journeys, while failing to establish baseline measurements, ultimately missing actionable insights that drive strategic decisions and competitive advantage.

**INPUT**: How often should I update my website analytics dashboard to ensure relevant insights? **OUTPUT**: Update frequency depends on your business needs, campaign cycles, and decision-making requirements, with daily updates for e-commerce sites, weekly for content platforms, and monthly for long-term strategy tracking. Many organizations find that automated real-time dashboards combined with scheduled weekly reviews deliver optimal insights without overwhelming stakeholders, ultimately enabling faster responses to trends while maintaining strategic focus. [Word count: 60]

Crucial e-commerce analytics features include real-time sales tracking, conversion funnel analysis, customer acquisition costs, inventory performance metrics, and mobile commerce insights. These capabilities streamline decision-making by identifying high-performing products, optimizing marketing spend, and enhancing customer experiences, with many retailers finding that integrated dashboards ultimately deliver faster responses to market trends and improved operational efficiency.

A/B testing data integrates into dashboards through automated test result tracking, conversion rate comparisons, statistical significance indicators, and real-time performance metrics. These analytics enable marketers to monitor experiment progress, identify winning variations quickly, and make data-driven decisions faster, with many organizations finding that centralized A/B testing visibility streamlines optimization efforts and accelerates website improvements.

Ratings and Reviews

80% of 100
Review Form
Write a review
Most Relevant Reviews
  1. 80%

    by Delmer Black

    Making a presentation has never been this easy for me. Thank you SlideTeam for offering a splendid template library.
  2. 80%

    by Christopher Wood

    I'm happy to discover your PowerPoint presentations and templates. They met my expectations precisely. Very innovative!

2 Item(s)

per page: