

Data Analysis Project Plan Data Analytics Transformation Toolkit





Try Before you Buy Download Free Sample Product
 Impress Your
 Audience
 100%
100% Editable
 Save Hours
 of Time


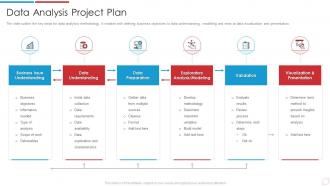
The slide outline the key steps for data analytics methodology. It initiates with defining business objectives to data understanding, modelling and ends at data visualization and presentation.
People who downloaded this PowerPoint presentation also viewed the following :
Data Analysis Project Plan Data Analytics Transformation Toolkit with all 6 slides:
Use our Data Analysis Project Plan Data Analytics Transformation Toolkit to effectively help you save your valuable time. They are readymade to fit into any presentation structure.





FAQs for Data Analysis Project Plan Data
Oh this is actually pretty simple! Descriptive analytics just shows you what already happened - like your sales dashboard from last quarter. Predictive takes that old data and tries to guess what's coming next, maybe which customers will bail on you. Then prescriptive is the smart one that tells you exactly what to do about it. Think of your fitness tracker - it shows your steps (descriptive), warns you're gonna gain weight (predictive), then suggests specific workouts (prescriptive). Most places start with descriptive because honestly, it's way easier to set up.
So data analytics is basically your crystal ball for understanding customers. Track their clicks, what they buy, support issues - there's crazy amounts of gold in that stuff. I'd start with just one area though, like your website or whatever, and really dive deep into those numbers first. Once you get the hang of it, you can start connecting different data sources to see the bigger picture. Honestly the coolest part is you'll spot problems before customers even realize they're annoyed. Plus you can personalize their experience way better.
Honestly, data cleaning is everything - your whole analysis depends on it. Bad data in, garbage insights out, you know? I usually tell people to budget like 70% of their time just on cleaning because missing values and duplicates will absolutely wreck your conclusions. It's annoying but necessary. You can't trust any results when your dataset is a mess. Think of it like trying to bake with spoiled milk - doesn't matter how good your recipe is. Clean data first, then you can actually make decisions with confidence.
Tableau and Power BI are the big names - super easy drag-and-drop stuff. Python people love matplotlib, seaborn, and plotly when they want custom charts. R's ggplot2 makes ridiculously pretty visualizations though. Google Data Studio works fine for quick dashboards and it's free. Excel's still solid for basic stuff too, honestly. I'd probably start with whatever your company already has licenses for, then maybe try Python if you hit walls. Oh, and don't let anyone shame you for using Excel - sometimes simple gets the job done faster than fancy tools.
Look, data analytics basically lets you make decisions based on real evidence instead of just winging it. You'll spot trends and figure out what's actually working versus what's a total disaster. It's way better than guessing - like having a crystal ball that doesn't lie to you. The patterns it shows are things you'd never catch on your own, plus you get to understand your customers and market on a deeper level. Honestly, I think the predictive stuff is the coolest part. Just start small though - grab whatever data you have for one decision you're wrestling with and see what it tells you.
Honestly, the messiest part is always your data - way worse than you expect. Missing stuff everywhere, formats that don't match, systems that refuse to work together. Plus good luck getting departments to actually share info with each other! Finding people who can make sense of the numbers AND turn that into real business moves? That's the real headache. Half your stakeholders won't even see why they need this stuff until you prove it works. My advice: pick one small project that'll show results fast. Once people see it actually helping, everything else gets way easier. Trust me on that one.
So there's actually tons of ways to work ML into your analytics. Predictive modeling helps forecast trends, which is super useful. Clustering algorithms will automatically segment your data - k-means is a good starting point. Anomaly detection catches those weird outliers you'd totally miss otherwise. For messy datasets (and honestly, aren't they all messy?), classification algorithms are clutch for organizing everything. You can also use ML for feature selection to figure out which variables actually impact your results. If you're dealing with customer stuff, recommendation engines work great too. I'd start simple with linear regression before diving into anything crazy complicated.
Honestly, privacy and ethics totally control everything you do in analytics now. What data can you even collect? How do you store it without screwing up? You've gotta think about consent, keeping datasets minimal, and whether your analysis might hurt certain groups. Way more complicated than like 5 years ago, but it's making us better analysts I guess. The trick is baking these checks into your process from the start instead of panicking about them later. Always ask "should we do this?" before you dive into "how can we do this?" with any dataset.
Start with impact, not data points. Tell them what it means for their business first, then show the numbers that back it up. Bar charts are your friend - anything fancier and they'll check out mentally. I learned this the hard way lol. Frame everything around decisions they actually need to make, not just cool insights you found. Ditch the technical jargon completely. When you have to explain something complex, use analogies they'll get. Oh, and prep for questions by thinking like someone who avoids Excel at all costs. They'll ask stuff you didn't expect.
Oh totally! Google Analytics is free and honestly does way more than most people realize. Same with Google Sheets - I use it for everything. If you're posting on social media, those built-in insights from Facebook and Instagram are actually pretty solid too. Most businesses I know are already sitting on useful data, they just don't look at it. Pick maybe 3-4 numbers that actually affect your money and start there. Don't overthink it. You can always get fancier tools later once you figure out what you're doing.
Honestly, ROI from your analytics projects is where I'd start - that's what executives actually care about. Track how fast you can answer big questions (time-to-insight) and whether decisions are getting better. Data quality scores matter too, obviously. But here's the thing - user adoption is huge. I've seen so many beautiful dashboards that just collect digital dust. Are people actually logging in? Using self-service features? Also keep an eye on operational stuff like pipeline reliability. Don't go crazy though - pick 3-4 metrics that align with your business goals first.
So basically, real-time analytics handles data as it comes in - like watching a live dashboard. Traditional stuff works in batches with old data, more like those monthly reports nobody reads until way later. Speed's the main thing here. You can catch problems instantly with real-time, like fraud happening right now or your site going down. Traditional's still useful for spotting trends and planning ahead, but honestly? It's pretty slow when you need to act fast. If your business changes quickly or you're making decisions that can't wait, definitely look into real-time for the stuff that matters most.
Google and Netflix are killing it with data analytics right now - they're way ahead of everyone else. Finance and healthcare companies are doing some pretty cool stuff too. Amazon's recommendation system is honestly kind of scary how good it is. Even sports teams are getting into predictive analytics now, which is wild. But healthcare might be the most impressive - they're using data to catch diseases early and figure out better treatments. Manufacturing and retail are stepping up their game too. If you want to see what's possible, I'd start by looking at case studies from those industries.
Dude, analytics is like having x-ray vision for your supply chain. You'll catch bottlenecks early, predict when demand's about to spike, and actually know how much inventory you need. Track supplier performance, delivery times, all that stuff - plus it finds patterns you'd never notice yourself. Most companies are bleeding money until they start measuring things properly, which is honestly wild to me. Oh, and don't try analyzing everything at once or you'll go crazy. Pick one problem area first and build from there. Way less overwhelming that way.
Honestly, focus on three main things: tech skills, thinking analytically, and being able to explain stuff clearly. SQL is a must for database work, then pick up Python or R for the actual analysis part. Tableau and Power BI are great for making charts that don't suck. Excel's still everywhere too - way more than people want to admit lol. You need to get good at asking smart questions and spotting patterns in data. But here's what trips people up: you've got to turn all those numbers into stories that your non-tech coworkers can actually understand and act on. Start with SQL and Python.
-
Wonderful templates design to use in business meetings.
-
Really like the color and design of the presentation.