

Business Intelligence Transformation Toolkit Powerpoint Presentation Slides





Try Before you Buy Download Free Sample Product
 Impress Your
 Audience
 100%
100% Editable
 Save Hours
 of Time


Business intelligence tools store the companys data in a single repository and present findings in reports, summaries, dashboards, scorecards, graphs, charts, and maps as per the users needs. Grab our efficiently designed Business Intelligence Transformation Toolkit template with an exhaustive set of templates covering the business case, project roadmap, business requirements, and implementation considerations for the BI project. This ppt also covers the BI tool selection aspect, with templates covering software features and vendor mini-profiles. The manager can compare and evaluate the options available in the market. Also, using the ppt templates such as the RACI matrix and workstreams and roles, the user can define the responsibilities of employees involved in the business transformation with the BI suite for targeted growth. This ppt is of great use to top management for successfully deploying the BI suite in the organization to harness the power of data for improved decision-making. The set of detailed templates helps in the effective planning of the BI project by covering all possible risks, thus saving both the cost and time of the company. Download it now.
People who downloaded this PowerPoint presentation also viewed the following :
Content of this Powerpoint Presentation
Slide 1: This slide introduces Business Intelligence Transformation Toolkit. State Your Company Name and begin.
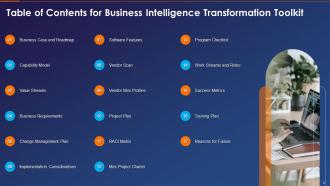
Slide 2: This slide presents Table of Content for the presentation.
Slide 3: This slide highlights title for topics that are to be covered next in the template.
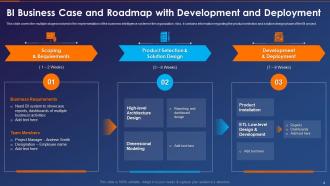
Slide 4: This slide shows BI Business Case and Roadmap with Development and Deployment.
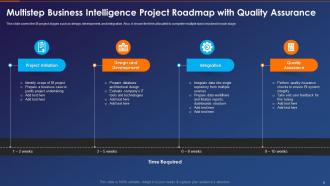
Slide 5: This slide presents Multistep Business Intelligence Project Roadmap with Quality Assurance.
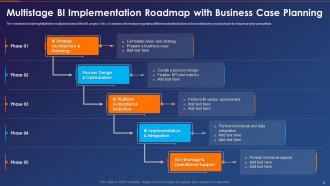
Slide 6: This slide displays Multistage BI Implementation Roadmap with Business Case Planning.
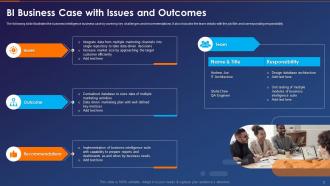
Slide 7: This slide represents BI Business Case with Issues and Outcomes.
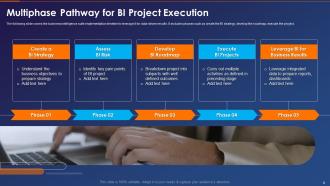
Slide 8: This slide showcases Multiphase Pathway for BI Project Execution.
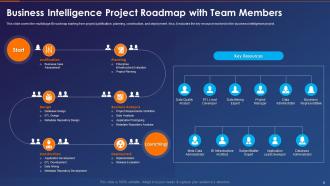
Slide 9: This slide shows Business Intelligence Project Roadmap with Team Members.
Slide 10: This slide highlights title for topics that are to be covered next in the template.
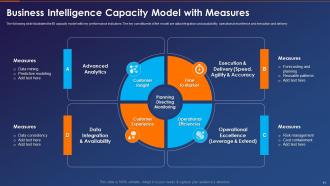
Slide 11: This slide presents Business Intelligence Capacity Model with Measures.
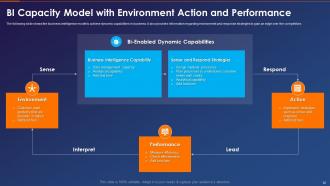
Slide 12: This slide displays BI Capacity Model with Environment Action and Performance.
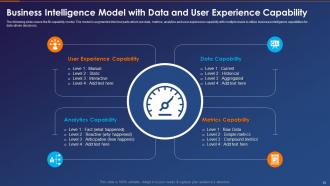
Slide 13: This slide represents Business Intelligence Model with Data and User Experience Capability.
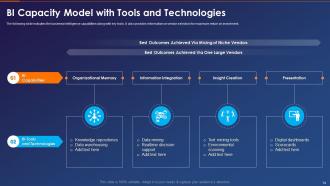
Slide 14: This slide showcases BI Capacity Model with Tools and Technologies.
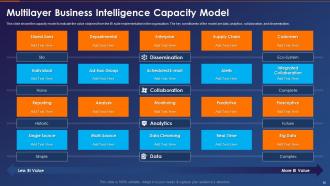
Slide 15: This slide shows Multilayer Business Intelligence Capacity Model.
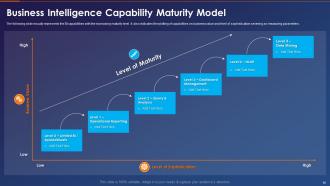
Slide 16: This slide presents Business Intelligence Capability Maturity Model.
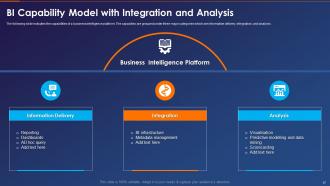
Slide 17: This slide displays BI Capability Model with Integration and Analysis.
Slide 18: This slide highlights title for topics that are to be covered next in the template.
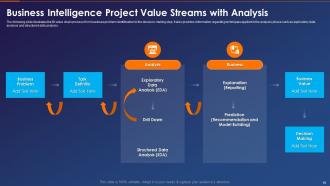
Slide 19: This slide represents Business Intelligence Project Value Streams with Analysis.
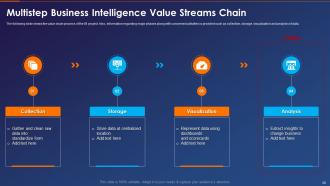
Slide 20: This slide showcases Multistep Business Intelligence Value Streams Chain.
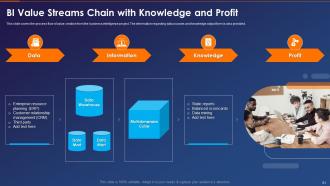
Slide 21: This slide shows BI Value Streams Chain with Knowledge and Profit.
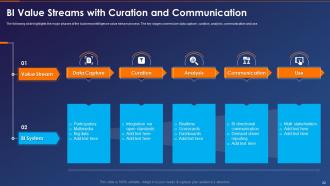
Slide 22: This slide presents BI Value Streams with Curation and Communication.
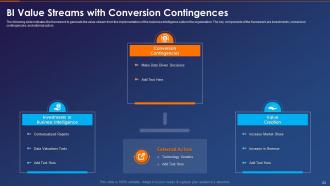
Slide 23: This slide presents BI Value Streams with Conversion Contingences.
Slide 24: This slide highlights title for topics that are to be covered next in the template.
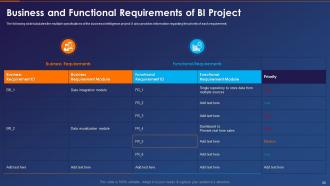
Slide 25: This slide displays Business and Functional Requirements of BI Project.
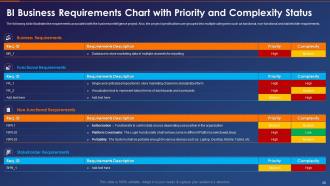
Slide 26: This slide represents BI Business Requirements Chart with Priority and Complexity Status.
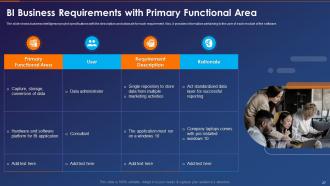
Slide 27: This slide showcases BI Business Requirements with Primary Functional Area.
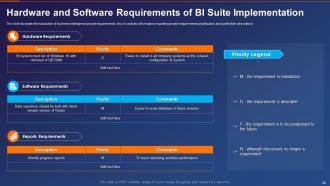
Slide 28: This slide shows Hardware and Software Requirements of BI Suite Implementation.
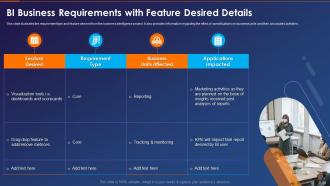
Slide 29: This slide presents BI Business Requirements with Feature Desired Details.
Slide 30: This slide highlights title for topics that are to be covered next in the template.
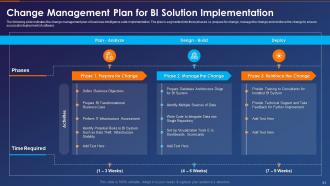
Slide 31: This slide displays Change Management Plan for BI Solution Implementation.
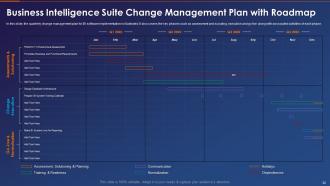
Slide 32: This slide represents Business Intelligence Suite Change Management Plan with Roadmap.
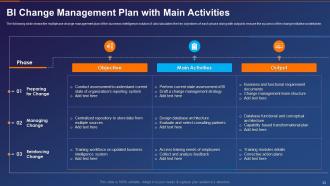
Slide 33: This slide showcases BI Change Management Plan with Main Activities.
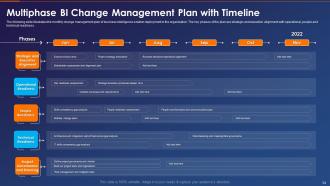
Slide 34: This slide shows Multiphase BI Change Management Plan with Timeline.
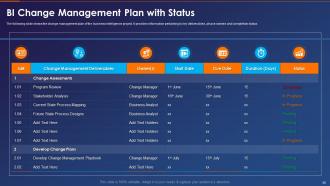
Slide 35: This slide presents BI Change Management Plan with Status.
Slide 36: This slide highlights title for topics that are to be covered next in the template.
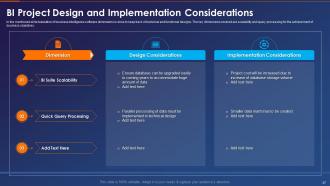
Slide 37: This slide displays BI Project Design and Implementation Considerations.
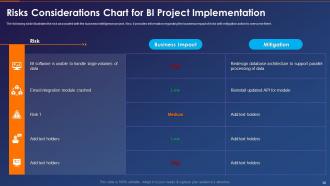
Slide 38: This slide represents Risks Considerations Chart for BI Project Implementation.
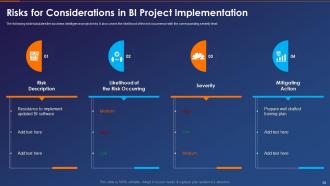
Slide 39: This slide showcases Risks for Considerations in BI Project Implementation.
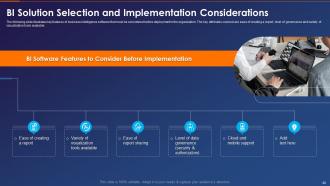
Slide 40: This slide shows BI Software Features to Consider Before Implementation.
Slide 41: This slide highlights title for topics that are to be covered next in the template.
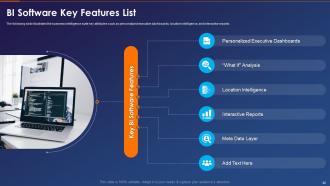
Slide 42: The following slide illustrates the business intelligence suite key attributes.
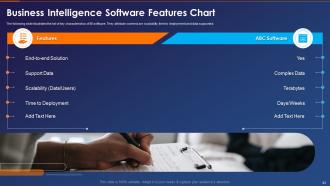
Slide 43: This slide presents Business Intelligence Software Features Chart.
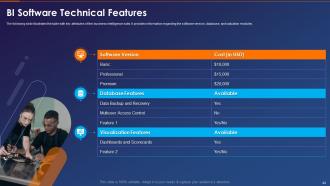
Slide 44: The following slide illustrates the table with key attributes of the business intelligence suite.
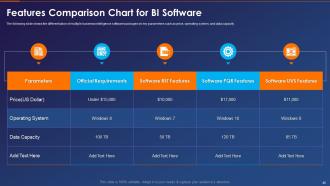
Slide 45: This slide displays Features Comparison Chart for BI Software.
Slide 46: This slide highlights title for topics that are to be covered next in the template.
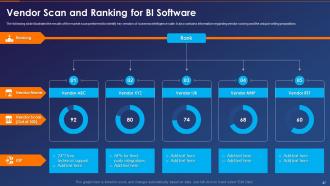
Slide 47: This slide represents Vendor Scan and Ranking for BI Software.
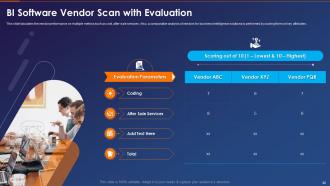
Slide 48: This slide showcases BI Software Vendor Scan with Evaluation.
Slide 49: This slide highlights title for topics that are to be covered next in the template.
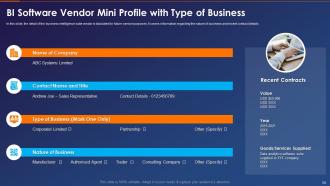
Slide 50: This slide shows BI Software Vendor Mini Profile with Type of Business.
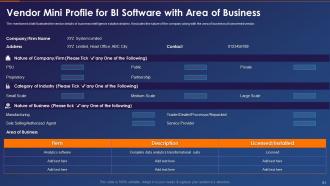
Slide 51: This slide presents Vendor Mini Profile for BI Software with Area of Business.
Slide 52: This slide highlights title for topics that are to be covered next in the template.
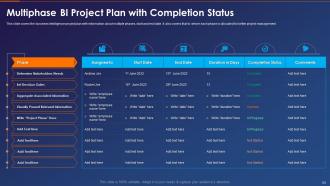
Slide 53: This slide displays Multiphase BI Project Plan with Completion Status.
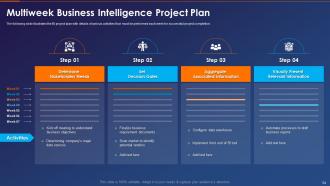
Slide 54: This slide represents Multiweek Business Intelligence Project Plan.
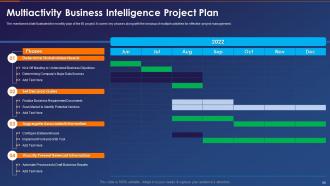
Slide 55: This slide showcases Multiactivity Business Intelligence Project Plan.
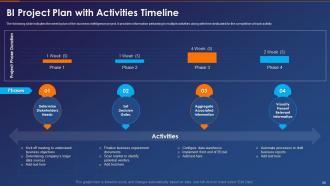
Slide 56: This slide shows BI Project Plan with Activities Timeline.
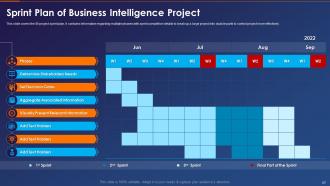
Slide 57: This slide presents Sprint Plan of Business Intelligence Project.
Slide 58: This slide highlights title for topics that are to be covered next in the template.
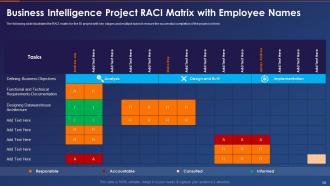
Slide 59: This slide displays Business Intelligence Project RACI Matrix with Employee Names.
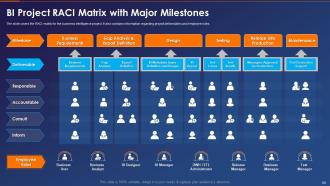
Slide 60: This slide represents BI Project RACI Matrix with Major Milestones.
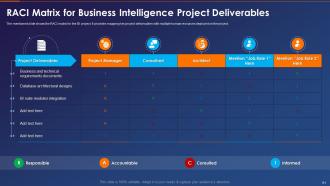
Slide 61: This slide showcases RACI Matrix for Business Intelligence Project Deliverables.
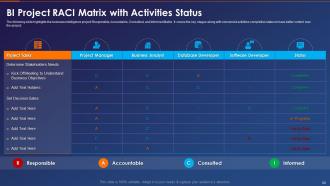
Slide 62: This slide shows BI Project RACI Matrix with Activities Status.
Slide 63: This slide highlights title for topics that are to be covered next in the template.
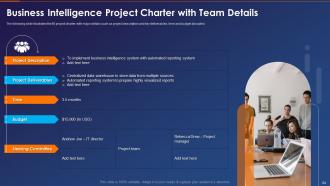
Slide 64: This slide presents Business Intelligence Project Charter with Team Details.
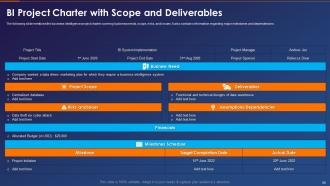
Slide 65: This slide displays BI Project Charter with Scope and Deliverables.
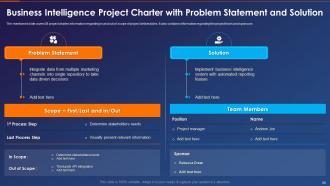
Slide 66: This slide represents Business Intelligence Project Charter with Problem Statement and Solution.
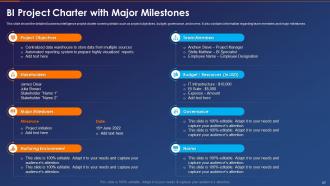
Slide 67: This slide showcases BI Project Charter with Major Milestones.
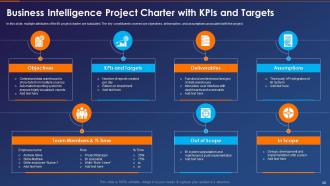
Slide 68: This slide shows Business Intelligence Project Charter with KPIs and Targets.
Slide 69: This slide highlights title for topics that are to be covered next in the template.
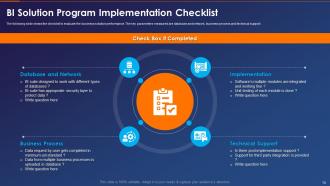
Slide 70: This slide presents BI Solution Program Implementation Checklist.
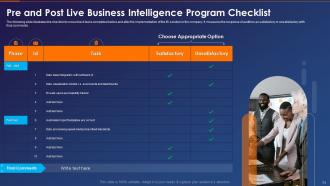
Slide 71: This slide displays Pre and Post Live Business Intelligence Program Checklist.
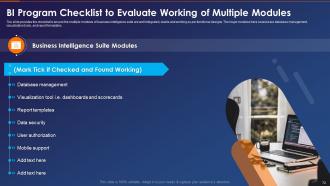
Slide 72: This slide represents BI Program Checklist to Evaluate Working of Multiple Modules.
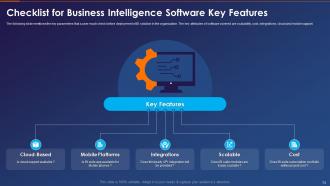
Slide 73: This slide showcases Checklist for Business Intelligence Software Key Features.
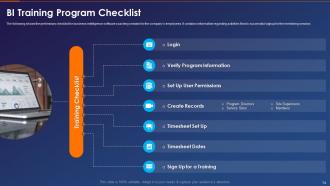
Slide 74: The following shows the preliminary checklist for business intelligence software.
Slide 75: This slide highlights title for topics that are to be covered next in the template.
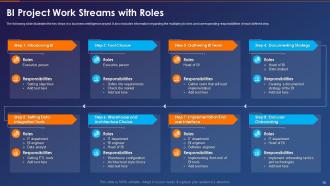
Slide 76: This slide presents BI Project Work Streams with Roles.
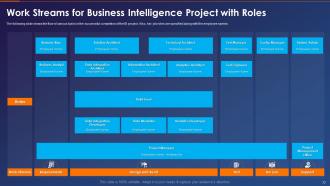
Slide 77: This slide displays Work Streams for Business Intelligence Project with Roles.
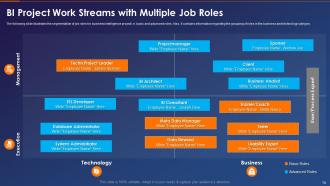
Slide 78: This slide represents BI Project Work Streams with Multiple Job Roles.
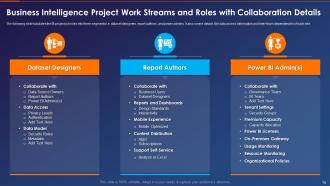
Slide 79: This slide showcases Business Intelligence Project Work Streams and Roles with Collaboration Details.
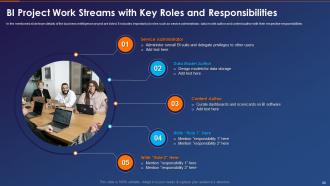
Slide 80: This slide shows BI Project Work Streams with Key Roles and Responsibilities.
Slide 81: This slide highlights title for topics that are to be covered next in the template.
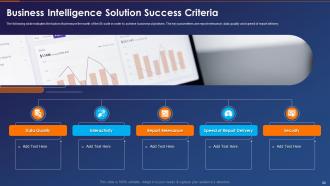
Slide 82: This slide presents Business Intelligence Solution Success Criteria.
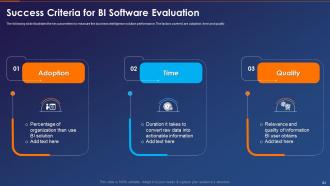
Slide 83: This slide displays Success Criteria for BI Software Evaluation.
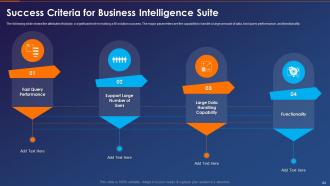
Slide 84: This slide represents Success Criteria for Business Intelligence Suite.
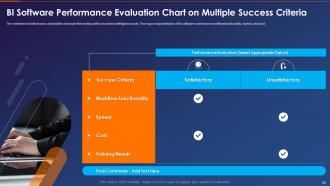
Slide 85: This slide showcases BI Software Performance Evaluation Chart on Multiple Success Criteria.
Slide 86: This slide highlights title for topics that are to be covered next in the template.
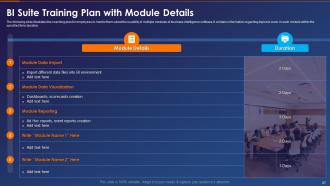
Slide 87: This slide shows BI Suite Training Plan with Module Details.
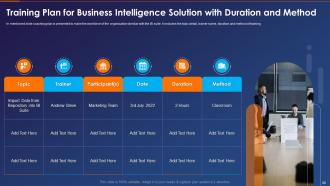
Slide 88: This slide presents Training Plan for Business Intelligence Solution with Duration and Method.
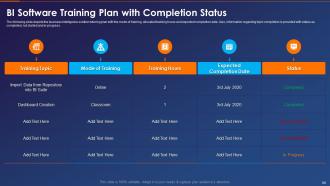
Slide 89: This slide displays BI Software Training Plan with Completion Status.
Slide 90: This slide highlights title for topics that are to be covered next in the template.
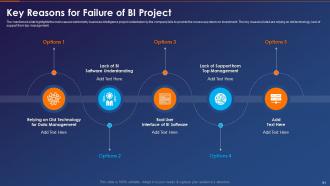
Slide 91: This slide represents Key Reasons for Failure of BI Project.
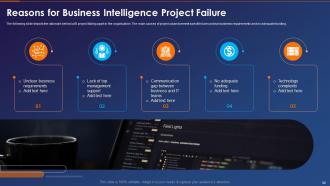
Slide 92: This slide showcases Reasons for Business Intelligence Project Failure.
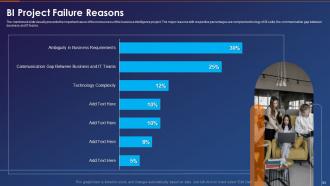
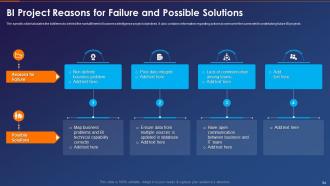
Slide 93: The mentioned slide visually presents the important cause of the nonsuccess of the business intelligence project.
Slide 94: This slide shows BI Project Reasons for Failure and Possible Solutions.
Slide 95: This slide presents Icons for Business Intelligence Transformation Toolkit.
Slide 96: This slide is titled as Additional Slides for moving forward.
Slide 97: This is Our Mission slide with related imagery and text.
Slide 98: This is About Us slide to show company specifications etc.
Slide 99: This is Our Team slide with names and designation.
Slide 100: This is Our Goal slide. State your firm's goals here.
Slide 101: This slide shows Post It Notes. Post your important notes here.
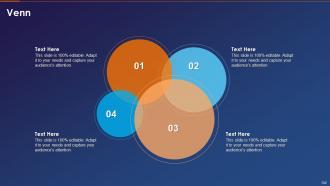
Slide 102: This slide depicts Venn diagram with text boxes.
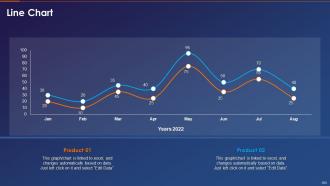
Slide 103: This slide describes Line chart with two products comparison.
Slide 104: This is a Timeline slide. Show data related to time intervals here.
Slide 105: This is a Thank You slide with address, contact numbers and email address.
Business Intelligence Transformation Toolkit Powerpoint Presentation Slides with all 110 slides:
Use our Business Intelligence Transformation Toolkit Powerpoint Presentation Slides to effectively help you save your valuable time. They are readymade to fit into any presentation structure.









FAQs for Business Intelligence Transformation Toolkit
Honestly, start with your data - if it's messy, nothing else matters. Get leadership on board early because I've seen so many projects crash without executive support. Build your tech stack right, but don't overthink it initially. Quick wins are everything here. Pick one area where you can show fast results - maybe customer analytics or something visible. That momentum carries you through the bigger stuff later. Oh, and train your people! Best data in the world won't help if your team doesn't know how to use it. I'd audit what you've got first, then just prioritize by business impact.
Honestly, you gotta track the obvious stuff first - how fast reports get done, whether your data's actually accurate now, and daily logins to the BI tools. If people aren't using it, you've got problems. Decision-making speed is another big one. Are teams moving faster? Saving money on automated processes? Here's what really matters though: listen to the questions people ask. When they stop going with their gut and start digging into actual data for answers, that's when you know it's working. Oh, and track those cost savings too - finance loves that stuff.
Honestly, data quality will make or break your whole BI project. Clean data first, fancy dashboards second - I can't stress this enough. Rushed teams always skip the boring cleanup work and go straight to building cool visualizations. Big mistake. Users lose trust super fast when reports show garbage numbers. Focus on your most important data sources and get those spotless before anything else. Otherwise you're basically building a mansion on swampland, and we both know how that ends. The cleanup work sucks but it's worth it.
So predictive analytics is like switching from looking backwards to actually seeing what's ahead. You're not just analyzing what already happened - you can forecast trends, predict how customers will behave, catch problems early. Honestly, it's one of the cooler parts of BI. When you're doing your transformation, try building models that forecast sales or spot equipment about to break down. My advice? Start with just one area where predictions would actually help your team make smarter calls. Don't go crazy trying to predict everything at once - that never works out well.
Honestly, your data's gonna be a nightmare - scattered everywhere and way messier than you think. People will fight you on ditching their beloved Excel sheets too. Then there's all the tech headaches: old systems that don't play nice, picking tools that actually work, finding someone who knows their stuff (good luck with that). Oh, and don't try fixing everything at once or you'll burn out fast. Pick one department first. Get a few quick wins so you can wave them around and prove it works, then slowly take over the world from there.
Honestly, cloud beats traditional BI hands down for scaling. When you need to crunch massive datasets, just spin up more resources instantly - no waiting around for IT to order servers (which takes forever). Then scale back down when you're done. The crazy part is you get access to ML tools that'd cost a fortune to build yourself. I love how quick you can test new data sources too. My advice? Figure out what's slowing your BI down most right now and find the cloud service that fixes it.
So AI and ML are completely changing how we do BI stuff. Instead of spending forever prepping data, it automates that whole mess. Real-time insights that actually adapt beat those static dashboards nobody looks at anyway. The predictive side is wild - like you can actually see what's coming instead of just what already happened. ML cleans up all your scattered data sources too, which honestly saves me hours every week. Oh and the pattern recognition catches things I'd totally miss. Pick one annoying repetitive task you're doing and test an AI tool on it first.
Honestly, just keep it simple at first. Your users need to actually understand what they're looking at - I've watched so many projects crash because teams went straight for the fancy heat maps without getting basic bar charts right. Stick with consistent colors and clear labels. Test everything with real people, not just your dev team. Here's the thing though - don't just throw data up there because you can. Every chart should answer a specific business question. Start small, see what works, then build from there. Trust me, boring dashboards that people use beat pretty ones that sit untouched.
Dude, the culture stuff is what kills most BI projects - way more than the tech ever does. People freak out about learning new systems or think they'll lose their jobs. Your executives need to actually care about data, not just say they do. Find a few people who are excited about this change and make them your unofficial champions. Training is huge obviously, but honestly? You have to sell the "why" first or nobody cares. I've watched companies blow millions on fancy dashboards that sit unused because they skipped all the people management. It's kind of ridiculous how often this happens.
Dude, don't try to build everything at once - that's where most people mess up. Also make sure the actual users want what you're creating, not just what management thinks they need. Clean data is huge too, otherwise you're just making fancy garbage. Oh and people hate change, so expect pushback even if your stuff is amazing. I'd honestly start with just one team first. Prove it works there, then expand. Focus on real problems they're having, not just cool-looking charts. Trust me, nobody cares how pretty your dashboard is if it doesn't help them do their job better.
Honestly, cross-departmental BI collaboration is a game changer. Each team has their own data perspective that you'd totally miss otherwise. Like when marketing loops in sales and finance with customer journey stuff - suddenly everyone's dashboards actually make sense together instead of being random pretty charts nobody looks at. Data quality gets way better too since different teams catch errors the others would miss. Oh, and people actually start using the reports instead of ignoring them. My advice? Start with shared KPI dashboards where teams contribute data and talk through it together. Don't try to boil the ocean right away.
Honestly, start with what you've got - audit your current setup first. Snowflake or AWS make solid foundations, then grab something like Tableau or Power BI for the visual stuff. Fivetran's pretty solid for connecting data sources (though there's like a million options now). The pipeline quality matters way more than having the fanciest tools, trust me. Maybe throw dbt in there for transformations if you're feeling ambitious. But seriously - pick 2 or 3 things that work together instead of trying every platform that exists. You'll drive yourself crazy otherwise.
Dude, real-time data processing is wild - it flips everything from "here's what happened last month" to "holy crap, this is happening NOW." No more waiting around for those overnight batch reports that nobody reads anyway. Live dashboards become actually useful when stuff hits the fan. Your stakeholders get addicted to instant insights pretty quick, so you'll need your data architecture to handle streaming. Oh and figure out what actually needs real-time monitoring first - most things can wait till morning honestly.
First thing - figure out where your BI stuff actually connects to what the company's trying to do. Like, are decisions taking forever because reports are stuck somewhere? Map that out. Get the executives on board early (trust me, without them you're screwed). Pick which business areas need BI help most based on real impact, not just what seems cool. Build your rollout plan around actual business milestones - it'll make way more sense that way. Set up metrics that track both how well the BI works AND whether it's actually helping the business. The whole point is making BI serve the business goals, not being a fancy tech thing that sits there looking pretty.
Look, data governance is like setting up ground rules so your BI project doesn't turn into a mess later. You'll get inconsistent numbers, security holes, and nobody trusting the reports if you skip this part. Honestly, I've seen too many companies build these amazing dashboards only to have someone ask "how'd we get this number?" and nobody knows. Start simple - figure out your most important data and put someone in charge of it. Set up quality checks and decide who can access what. Otherwise you're building something that looks great but falls apart when people actually need to rely on it.
-
Best way of representation of the topic.
-
Easily Editable.