


Business intelligence and analytics powerpoint presentation slides


Try Before you Buy Download Free Sample Product
 Impress Your
 Audience
Editable
of Time


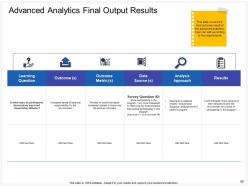
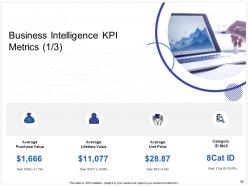
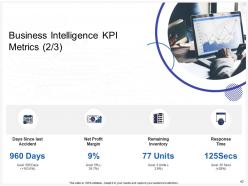
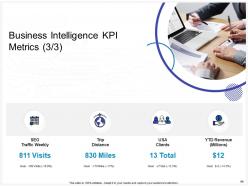
Introducing Business Intelligence And Analytics PowerPoint Presentation Slides. The presentation contains various templates explaining market overview, architecture framework, data design, data integration design, BI design, advanced final output results, KPI metrics, and dashboards. Display valuable business insights with the help of our professionally designed operational intelligence PPT slideshow. Other important information like industries that use BI and key drivers is also depicted in our artificial intelligence PPT deck. This commercial intelligence presentation aptly showcases how BI assists in developing business. Take the assistance of industrial AI PPT layouts to demonstrate sophisticated subjects like information architecture, and dimensional modeling easily. You can convey your BI design and implementation in a compact manner with our extremely useful business intelligence PowerPoint diagrams. This integrated business planning PowerPoint theme also sheds light on advanced analytics techniques and methods. Download the artificial intelligence ppt to represent your plan to expand business horizons.
People who downloaded this PowerPoint presentation also viewed the following :
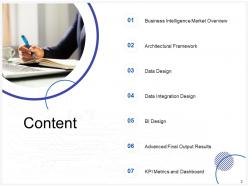
Content of this Powerpoint Presentation
Data is one of the most powerful tools in today’s landscape; it plays a significant role in taking businesses to the path of success. Data-driven decisions provide you with a competitive edge in a world entirely of competition, and it has become so critical to harness the power of data. Business intelligence and analytics are related to extracting valuable insights from data and making informed decisions. There are various tools for this endeavor in this organization, and tracking them is essential.
Download our business intelligence transformation toolkit with major milestones!!!
SlideTeam has designed some ready-to-use PPT templates to give an overview of the process in sight. These templates use creative and attractive visuals to make the PPT presentation captivating. Organizations that strive to keep an overview of business intelligence and analytics can have these templates so they can track the process and keep the overview in a single place.
If you want to prepare a report on business intelligence, explore our ready-to-use PPT template!!
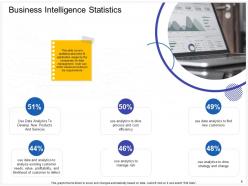
Template 1: Business Intelligence Statistics

This template mainly deals with statistics about business intelligence applications and usage by various companies in data management. Through this ready-to-use PPT slide, you can demonstrate the percentage along with the additional space to describe what organizations do. For instance, it highlights that 51% of the companies use data analytics to develop new products and services, 46% of companies to manage risks, and 48% of the total companies use analytics to drive strategy and change. As these are entirely editable templates, you can add the information according to your company’s needs.
Template 2: Business Intelligence Trends
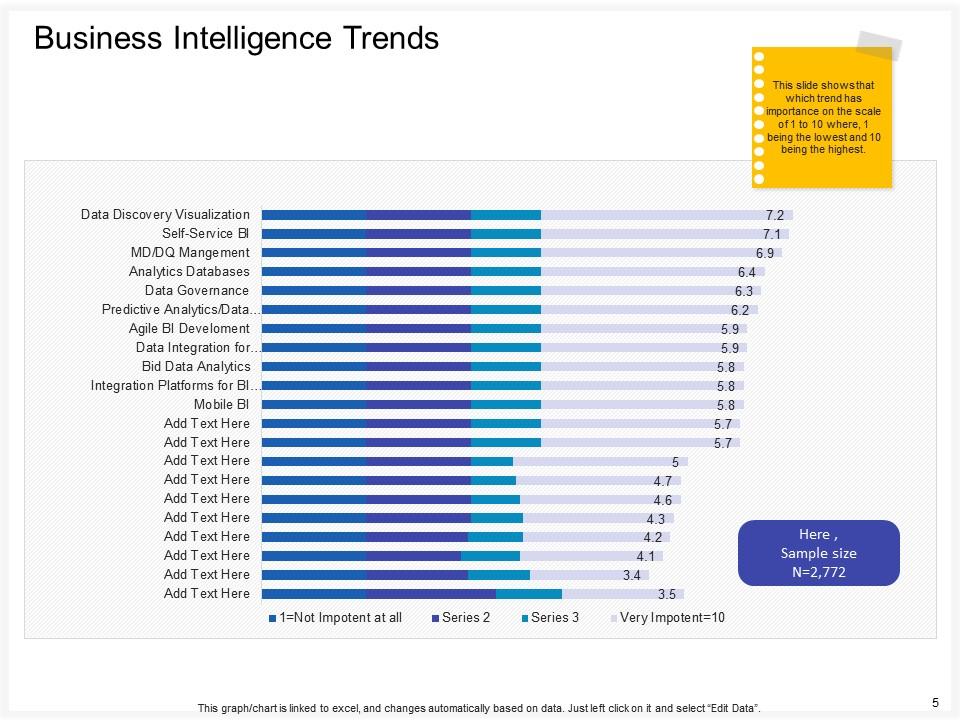
This template helps demonstrate the business intelligence trends on a scale of 1 to 10. Various business intelligence techniques are used by various organizations nowadays. These PPT slides help in organizing the trendiest techniques according to their popularity. Some of them are data discovery visualization, an integration platform for business intelligence, mobile business intelligence, big data analytics, data integration, agile business intelligence, data governance, analytic databases, and many more. There is an additional space to add more techniques according to your requirements.
Template 3: Business Intelligence Trends for Tools being used in Industry
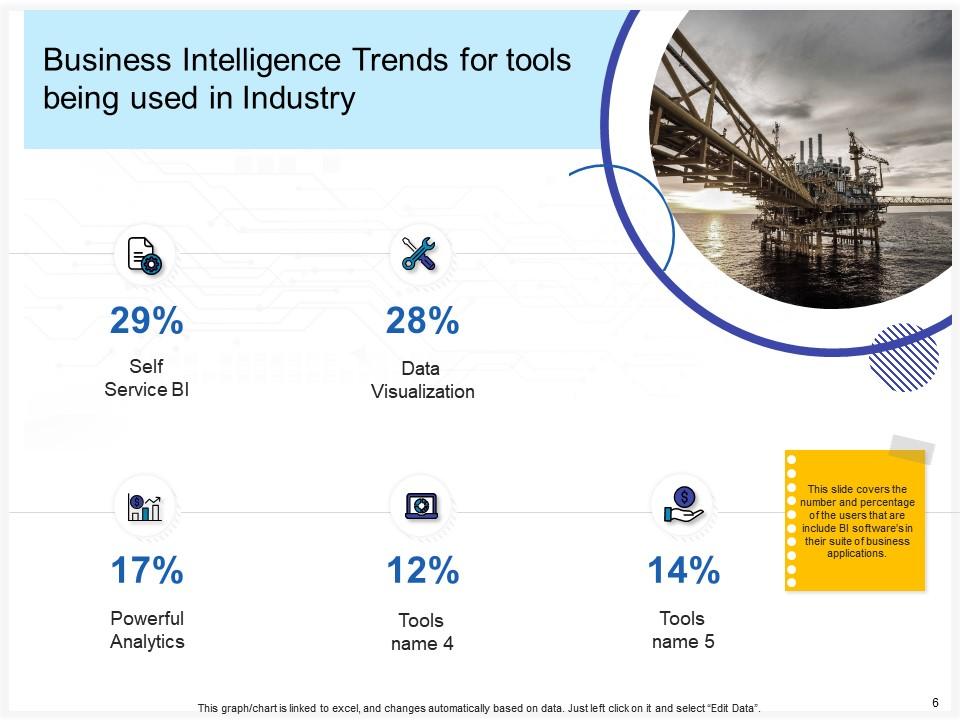
Some tools are used in industry for business intelligence. This PPT slide quickly demonstrates these tools, such as self-service BI, Powerful Analytics, Data Visualization, Self-Service BI, and many more. Impressive icons show the number and percentage of users who add business intelligence software to business applications.
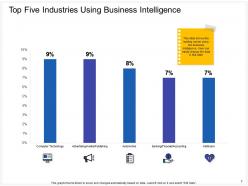
Template 4: Top 5 Industries using Business Intelligence
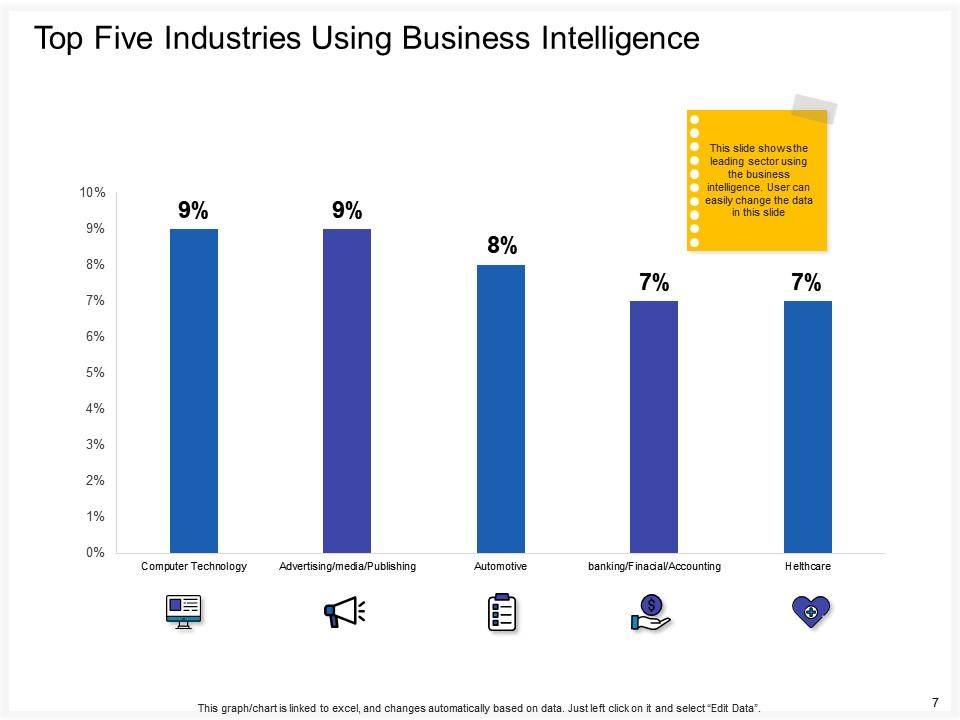
There are different kinds of industries that use business intelligence. These ready-to-use PPT slides help in demonstrating which industry uses it more. This template helps you to add industries like computer technology, advertising, media, publishing, automotive, banking, financial, accounting, and healthcare. Through the help of graphs and innovative icons, you can highlight the leading sector with business intelligence.
Template 5: Key Drivers
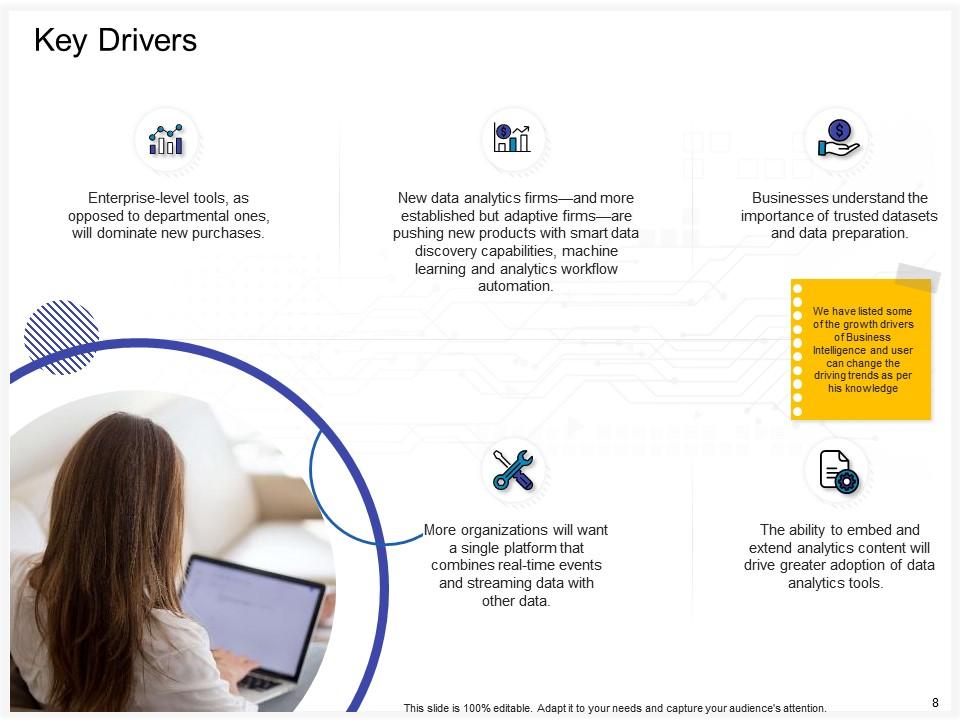
An organization must be aware of its growth drivers, and this template helps demonstrate that. There are some enterprise-level tools that certainly dominate the new purchases. These slides highlight the importance of trusted datasets and data preparation ability to embed and extend analytics content, organizations want a single platform that combines real-time events and streaming data with other data through creative icons.
Template 6: Business Intelligence Market Size
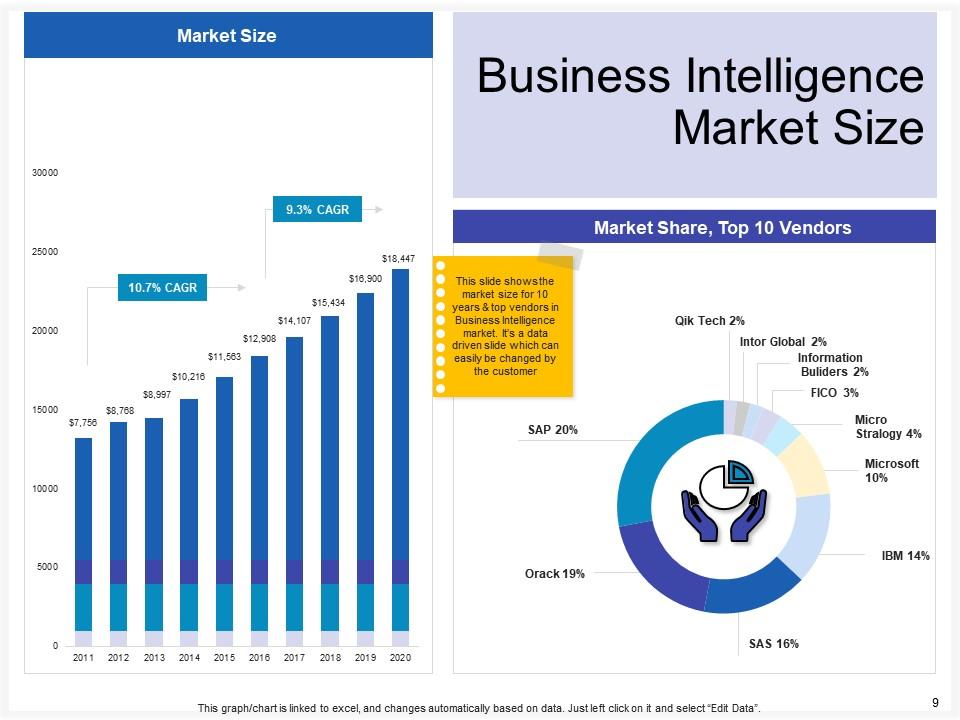
Demonstrate the market size of business intelligence with this specific template. This slide will allow you to highlight the Business Intelligence market size through attractive visuals and charts. The above image clearly shows the market size of BI. As these slides are editable, you can edit the market size according to your needs and the actual size at that time. You can also determine whether the market size of BI has increased or decreased through different years.
Template 7: Market Evolution in the Business Intelligence Industry
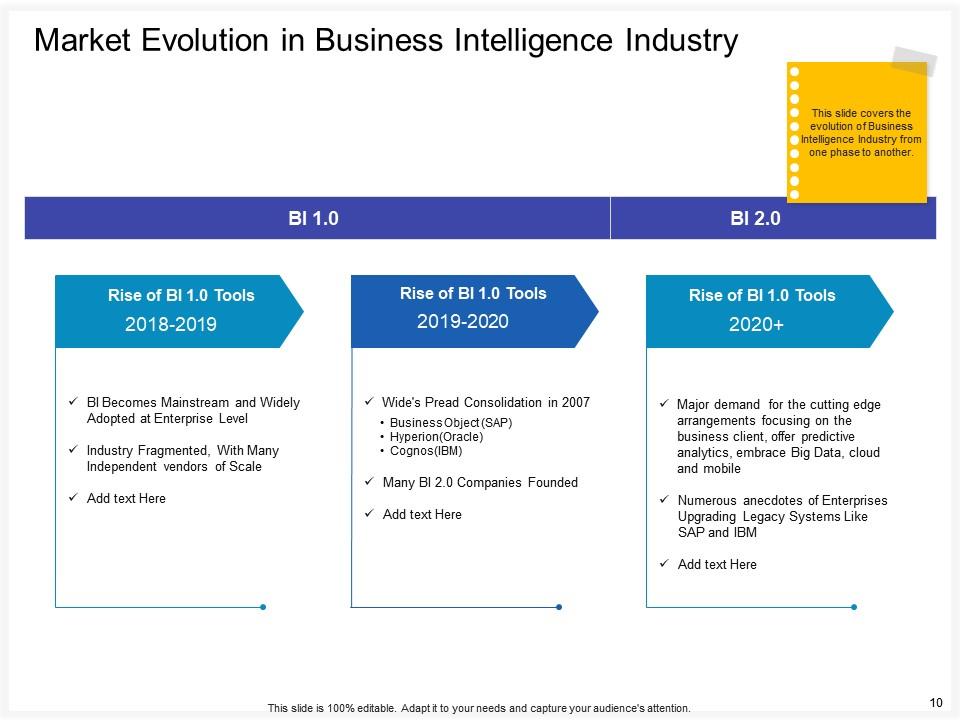
Evolution happens in everything, be it machines, humans, or business intelligence. This PPT template helps describe the rise in BI tools over the years. You can easily define the rise in different years in separate columns. You can easily discuss the evolution of BI in different phases. The impressive icons and attractive template design make the differentiation simple and easy to understand.
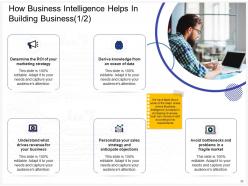
Template 8: How Business Intelligence Helps in Building Businesses

Business Intelligence plays a crucial role in building businesses, and this template helps demonstrate this. There are separate spaces that define how BI helps in building businesses. BI helps in understanding what drives revenue for your business, personalizing your sales strategy, avoiding problems in fragile markets, deriving knowledge from an ocean of data, and determining the ROI of your marketing strategy.
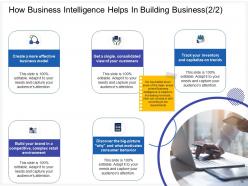
Template 9: How Business Intelligence Helps in Building Businesses

This is another template that defines the role of BI in building businesses. The BI helps in creating a more effective business model, getting consolidated views of customers, building brand in competitive, complex retail environment, discovering what motivates consumer behavior, and tracking inventory. The information can be easily understood through this ready-to-use creative template.
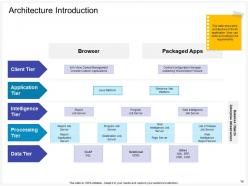
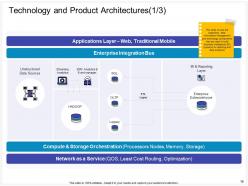
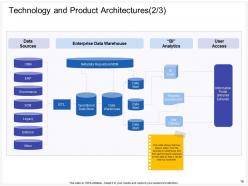
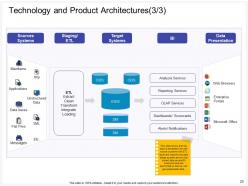
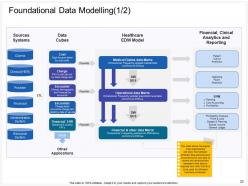
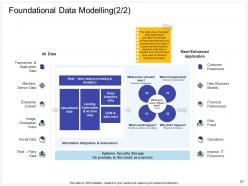
Template 10: Architecture Introduction

This template helps demonstrate the architectural plan of Business Intelligence according to requirements. Client tier, application tier, intelligence tier, processing tier, data tier, and other platforms and browsers like report job server, window platform, java platform, list of values job server, destination job server, and web intelligence job server can be easily demonstrated through this PPT template.
In conclusion, the power of data can be unleashed through data. Explore the fundamental concepts, tools, and techniques that enable businesses to transform raw data into insights. Our PPT slides will help expand your knowledge and act as a comprehensive guide to navigating the complex world of BI and Analytics. Get these slides to understand how to make data-driven decisions.
P.S. Download our Mini Project Charter for Business Intelligence Transformation PowerPoint PPT Template Bundles!!
Business intelligence and analytics powerpoint presentation slides with all 61 slides:
Use our Business Intelligence And Analytics Powerpoint Presentation Slides to effectively help you save your valuable time. They are readymade to fit into any presentation structure.


FAQs for Business intelligence and analytics
Okay so BI strategy boils down to a few things. First, get your data governance sorted - can't make good calls with messy info. Your tech stack matters too for collecting and analyzing everything. Pick KPIs that actually connect to what you're trying to achieve (not just vanity metrics). You'll need people who can read the data properly, plus leadership backing because these projects crash without exec support. Oh and honestly? The whole company culture around data makes or breaks it. Everyone's gotta buy into why this stuff matters. I'd start by checking what data sources you have now and where the biggest decision-making blind spots are.
So basically these tools turn your messy data into charts and dashboards that actually make sense. Way better than staring at spreadsheet hell for hours. Your team will actually want to check out a clean dashboard instead of running away from another massive presentation (honestly, who has time for that?). The trick is matching the right visualization to what you're trying to show. I'd start simple - pick your most important metrics first. Build focused dashboards around those. You can always add more later, but getting those core KPIs visible is what matters most.
Dude, data quality is make-or-break stuff. Your dashboards can look incredible, but if the underlying data is trash? You're basically building a house on quicksand. I worked with this one team who spent forever on these gorgeous executive reports - turns out they were missing like 40% of their sales data the whole time. What a nightmare. Clean your data sources first, set up some basic quality checks, then worry about the pretty visualizations. Messy data = bad decisions = expensive mistakes. Trust me, audit everything before you get excited about those fancy charts.
So predictive analytics is where you look at your old data to figure out what'll probably happen next. Super useful for stuff like sales forecasting or figuring out which customers might bail on you. Honestly, once you start using it, going back feels like driving with a blindfold on. You can actually see market changes coming instead of scrambling after the fact. Plus it helps with inventory planning - though I guess that's more boring than the customer stuff. Start with something simple like quarterly sales predictions. You'll get hooked pretty quick once you see how much clearer everything becomes.
Honestly, it's mostly data chaos and stubborn people. Your info will be spread everywhere - different systems, inconsistent formats, total mess. Makes any analysis pretty worthless. People hate changing how they work too. Executives want results yesterday, employees dig in their heels, and IT gets overwhelmed trying to connect everything. Oh, and nobody budgets enough for training, which is huge. Start with just one team first. Clean up your data before doing anything else - I can't stress this enough. Then spend serious money on training right away.
So it really depends on what problems you're trying to solve. Retail folks obsess over customer buying patterns and inventory - helps them figure out pricing and what to stock. Healthcare is wild right now, they're using predictive stuff to spot patient issues before they happen (kind of creepy but cool). Manufacturing companies focus more on supply chain headaches and predicting when machines will break down. Banks obviously care about catching fraud and assessing risk. Here's the thing though - you can't just copy what everyone else does. Figure out what actually moves the needle in your specific industry first, then build around that.
So real-time data processing is pretty huge for BI stuff - basically you're making decisions on what's happening now instead of stale info from last week. Your dashboards actually show current reality, which is wild when you think about it. You can catch trends and problems as they pop up. The downside? Infrastructure costs can get messy fast if you're not careful. But honestly, being able to react to customer changes or supply issues immediately beats finding out about disasters way too late. I'd say pick one key data source first and see how it goes from there.
Honestly, just start with Google Analytics and throw together some basic Excel dashboards. You'd be shocked how much you can do before spending any real money. Power BI and Tableau have free versions too if you want prettier charts. But here's the thing - get your data sorted first. That's like 80% of the headache right there. Pick maybe 3-5 metrics that actually move the needle for your business instead of tracking every single thing (I learned this the hard way). Once you're seeing real results from the basics, then you can think about upgrading to fancier tools.
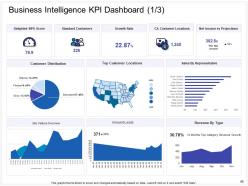
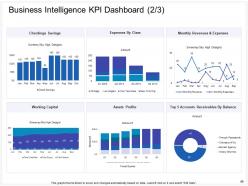
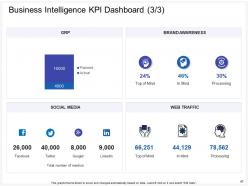
Honestly, it depends on what you're trying to achieve, but some KPIs are pretty standard. Revenue growth and profit margins are no-brainers. Customer stuff like acquisition costs and retention rates matter too. Oh, and conversion rates - those tell you a lot. Here's something people overlook: data quality metrics. I've worked with dashboards full of junk data that everyone just ignores, which defeats the whole purpose. Also track if people actually use your BI tools - otherwise you're just building fancy reports nobody looks at. Start with maybe 5-7 KPIs that connect to your main business goals. You can always add more later once you've got the basics down.
So AI and ML basically automate all the tedious stuff in BI and catch patterns you'd miss. Your team can ask questions in normal English and get instant answers - which honestly feels like magic the first time you see it. The algorithms rip through huge datasets way faster than regular BI tools ever could. You'll get predictive analytics, real-time alerts when something's off, and automated insights without building reports manually. I'd probably start with something straightforward like sales forecasting. Oh, and the time savings are genuinely insane once you get it running.
Honestly, find your power users first - they'll do half the selling for you. Training needs to be hands-on with real work stuff, not boring generic demos. Quick wins are everything... like automating those awful weekly reports nobody wants to touch. Success stories help a ton too, so keep sharing those wins around. But here's the thing - if your boss isn't actually using the dashboards in meetings, forget it. People watch what leadership does way more than what they say. Oh, and don't make it feel like extra work on top of everything else they're already doing.
So basically, cloud BI runs on someone else's servers while on-premise stuff sits in your office. Cloud's way quicker to get running - we're talking hours not months, which is honestly a game changer. You'll get updates automatically and can scale without buying more hardware. Monthly payments vs. huge upfront costs too. Downside? Less control over tweaking things exactly how you want, plus some people get nervous about their data living elsewhere. I'd probably figure out if your IT team can actually handle managing everything first - that's usually the deciding factor.
Honestly, the biggest things to worry about are privacy, bias, and being upfront about your methods. Only grab data you actually need and make sure people agreed to share it. Bias is where companies really mess up though - your algorithms can accidentally discriminate if you're not careful about data sources. I've watched this blow up in people's faces! Be honest with stakeholders about what your data can't tell you too. Oh, and always think: would I be cool explaining this process to the actual people whose data I'm using? That's usually a good gut check.
So you'll want to measure both the easy stuff and the harder-to-quantify benefits. The no-brainers are things like how much faster reports get done, quicker decisions, cutting out manual work - pretty straightforward math there. Revenue stuff gets trickier but look at better forecasting, customer insights, inventory improvements. Don't skip the fuzzy metrics either like employee satisfaction or whether people actually use data more (honestly that culture shift can be huge). Track it all for like 12-18 months minimum. Oh and set up some kind of monthly dashboard thing so you can keep showing leadership why this was worth it.
Honestly, the BI space is moving crazy fast right now. AI analytics where you can literally just ask questions in normal English instead of wrestling with SQL queries - that's becoming massive. Real-time data is everywhere too since waiting around for reports feels ancient at this point. Your business teams probably want those self-service dashboards so they're not constantly hitting up IT for everything. Oh, and there's this augmented stuff that basically finds patterns for you automatically, which is pretty wild. I'd figure out what's driving you most nuts about your current setup and start there.
-
Easily Editable.
-
Awesome use of colors and designs in product templates.
-
Helpful product design for delivering presentation.
-
Innovative and attractive designs.