Data Analytics Project Plan Powerpoint Ppt Template Bundles

Rating:
100%
Data Analytics Project Plan Powerpoint Ppt Template Bundles
Slide 1 of 21
Favourites Favourites

Try Before you Buy Download Free Sample Product

Audience Impress Your
Audience
Editable 100%
Editable
Time Save Hours
of Time
The Biggest Sale is ending soon in
0
0
:
0
0
:
0
0
Rating:
100%
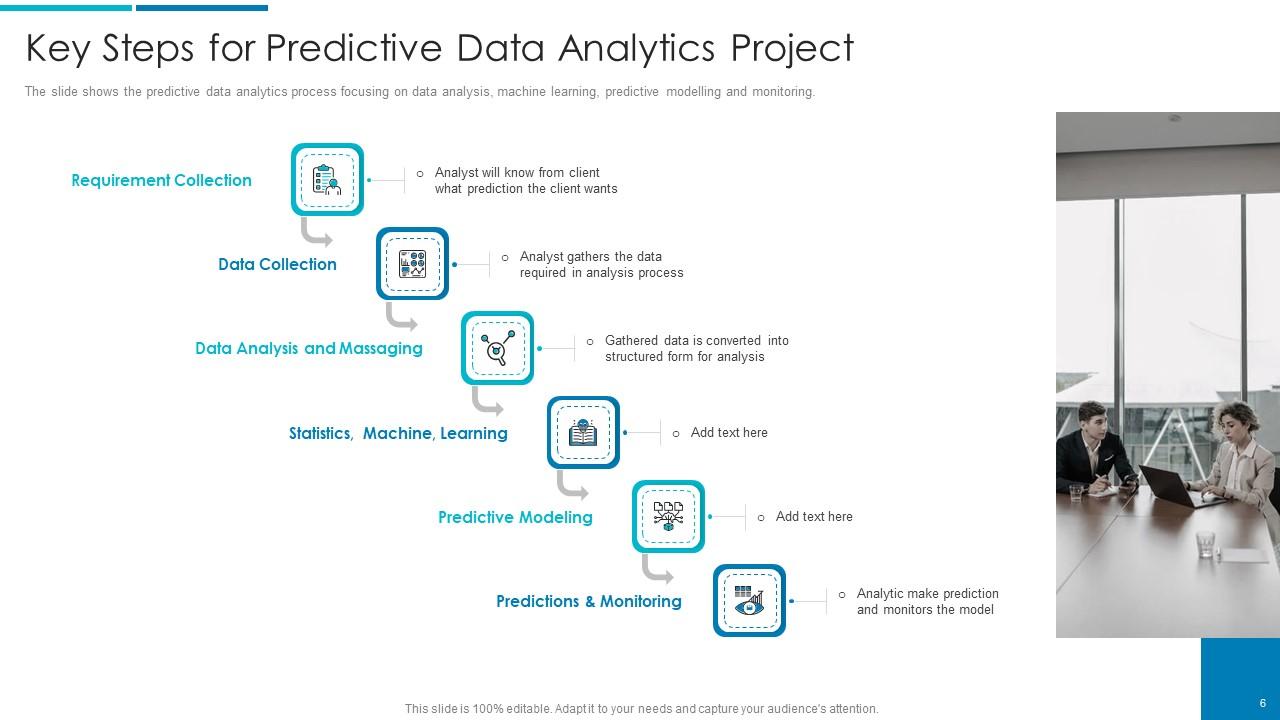
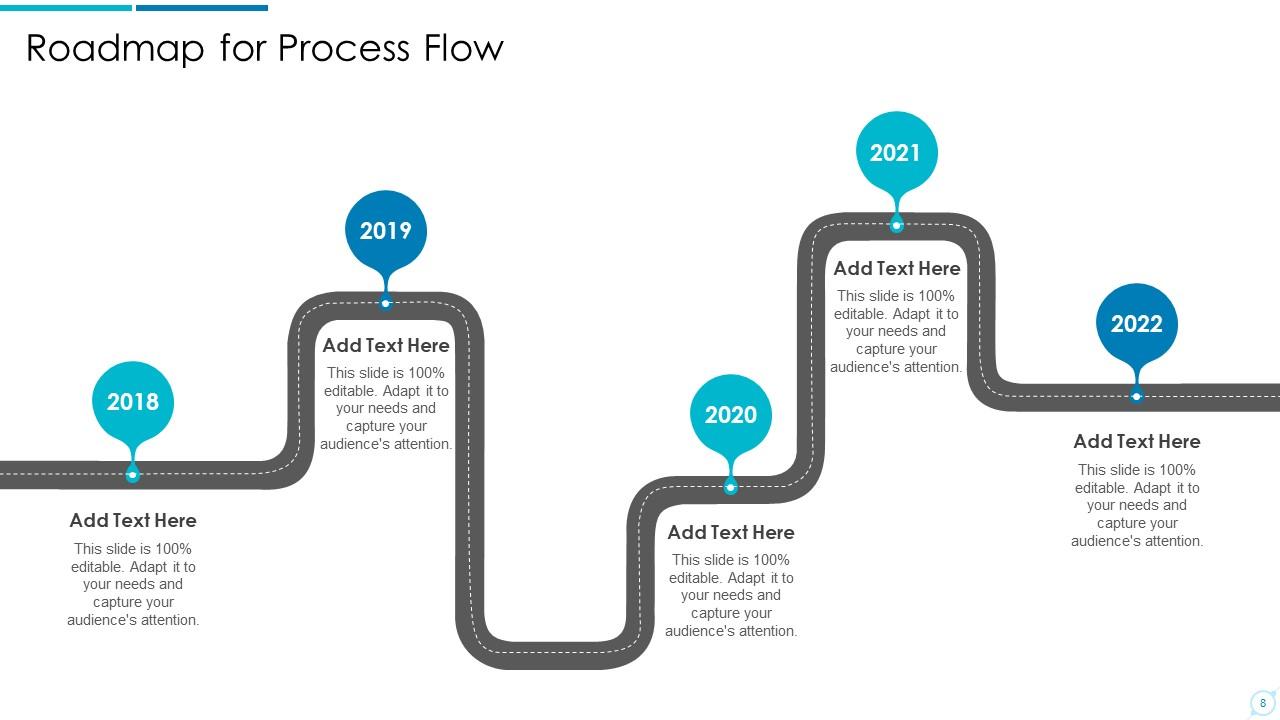
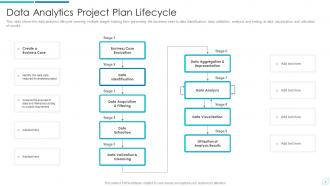
Deliver a credible and compelling presentation by deploying this Data Analytics Project Plan Powerpoint Ppt Template Bundles. Intensify your message with the right graphics, images, icons, etc. presented in this complete deck. This PPT template is a great starting point to convey your messages and build a good collaboration. The sixteen slides added to this PowerPoint slideshow helps you present a thorough explanation of the topic. You can use it to study and present various kinds of information in the form of stats, figures, data charts, and many more. This Data Analytics Project Plan Powerpoint Ppt Template Bundles PPT slideshow is available for use in standard and widescreen aspects ratios. So, you can use it as per your convenience. Apart from this, it can be downloaded in PNG, JPG, and PDF formats, all completely editable and modifiable. The most profound feature of this PPT design is that it is fully compatible with Google Slides making it suitable for every industry and business domain.

FAQs for Data Analytics Project Plan Powerpoint

Focus on three main things: using data to guide business decisions, boosting operational efficiency, and spotting new revenue streams. Automating reports should be high on your list too - seriously, who has time for manual spreadsheet hell anymore? Set clear KPIs from the start so everyone knows what winning looks like. Data quality improvements are huge (garbage in, garbage out, right?). Here's what I'd do: write down your top 3 business questions first. Then work backwards to figure out your project scope. Makes the whole thing way more manageable.

Look, you've got four main groups to wrangle here. Business users define what they want, IT handles data access and security stuff, executives control budgets, and end users actually consume the insights. Each one's gonna pull you in different directions - business wants everything analyzed, IT worries about what's even possible, executives just want results fast and cheap. It's like herding cats sometimes! Map out who has the most influence early on. Oh, and definitely find a champion in each group who can help you navigate all the internal drama. Regular check-ins are key too.

So we're grabbing data from three places: your CRM, Google Analytics, and that customer survey thing from last quarter. I'll set up some automated checks to catch missing stuff and weird outliers. The survey data's probably gonna be pretty messy since people just type whatever, but that's normal - we can fix it later. Cross-referencing between sources should help us spot any funky inconsistencies. Oh, and I'm planning to manually check about 10% of each dataset before we dive in. Can you get me access to everything by next week? Need to start pulling the data soon.

So we're going with Python and pandas for the data crunching - NumPy too obviously. SQL handles database stuff. Tableau's my pick for visualizations since it actually works with what we have, though PowerBI could work. APIs and CSV imports for data collection, pretty standard. Oh and Jupyter notebooks for exploration because honestly they're just better for keeping track of what you tried. Your team needs to brush up on Python basics if they haven't. I'll get everyone Tableau access next week.

Look, you gotta bake privacy stuff into every step from the start. Anonymize personal info right away and get proper consent - trust me, this becomes a nightmare if you wing it. Set up role-based access so people only see what they actually need to see. Document everything you do with the data too. Privacy audits should happen regularly throughout the project. Oh and definitely make a data governance checklist now before things get crazy. Your stakeholders will grill you later about all this stuff, so having your ducks in a row saves major stress down the line.

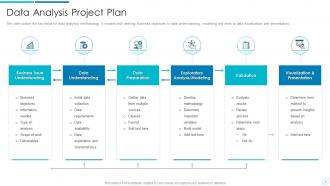
So we're talking about 12 weeks total, broken into four chunks. First 2-3 weeks is planning and gathering all the data you need. Then comes the heavy lifting - 4-5 weeks of analysis and modeling, though honestly this part always drags because data is never clean like you hope. Validation and testing takes another 2-3 weeks after that. Documentation and presenting to stakeholders wraps it up in 2 weeks. I'd definitely pad some extra time between phases since they tend to bleed into each other, especially analysis and validation. Want me to send over the detailed timeline doc?

Honestly, start with KPIs that actually connect to money - revenue growth, cost savings, better customer scores, whatever matters to your business. Technical stuff like model accuracy is fine but useless if it doesn't help the bottom line. Grab your baseline numbers before you launch anything. Then check back in like 3-6 months to see what changed. Oh and definitely ask the actual users what they think - sometimes the data looks great but people hate using it. Set up some basic dashboard so you're not flying blind. The key is mixing hard numbers with real feedback from people.

Oh man, data quality issues and scope creep will definitely bite you - they get literally everyone. I'd budget extra time upfront just for cleaning messy data and write down every assumption you make. Stakeholders love asking for "one more quick analysis" but just point them back to your original timeline when that happens. Also communication falls apart fast, so set up regular check-ins from the start. Random tip: always have a backup data source ready before you actually need it. Everything takes like 20% longer than you think it will anyway.

Weekly standups are your best friend - have everyone share what they're doing, what's blocking them, next steps. Slack's clutch for quick questions too. Honestly our best ideas come from those random chat threads, not formal meetings. Document everything in one place, whether that's Confluence or just Google Drive (whatever your team actually uses). Don't wait for people to ask for updates - just share them. Oh and definitely do a kickoff to set these habits early, otherwise it gets messy fast.

Here's what I'd focus on: accuracy and precision first - gotta know if your models actually work, right? Response time's huge too. Nobody wants to sit there waiting for results (trust me on this one). Also track data quality scores and how many people are actually using the thing. Business metrics like cost savings help prove ROI to the bosses. Honestly though, pick maybe 3-4 max that leadership cares about. Don't go overboard with dashboards - I've seen teams get totally lost in metrics that don't matter. Figure out what your stakeholders want before you build anything.

So you'll want to build an ETL pipeline to get everything talking to each other. Start by mapping out all your different data formats - yeah, it's boring but you gotta do it. Build some transformation scripts to clean up the mess and handle missing stuff. Everything should flow into one central warehouse with consistent tables. Oh and seriously, document your transformation rules as you go! I learned this the hard way when my boss came asking about some random numbers three months later and I had no clue how we'd calculated them. Trust me on this one.

Honestly, start with a skills audit to see what your team already has. SQL's gonna be essential for pulling data, plus Python or R for the actual analysis work. Whatever viz tool you pick - Tableau, Power BI, whatever - that's another thing to learn. But here's what people always overlook: the soft skills are just as critical. Your team needs to get good at explaining technical stuff to executives who don't know a pivot table from a coffee table. Oh, and if you're doing cloud stuff like AWS, that's a whole other beast. I'd tackle the technical foundations first, then work on the storytelling piece.

Honestly, I'd just make a simple scoring system - weigh what stakeholders want against business impact and how doable it actually is technically. Map their feedback to real outcomes like revenue or cost savings. Different people will want totally opposite things (classic), but you can sort that out by ranking stuff based on ROI and user impact. Keep everything in a shared tracker so people can actually see their input mattered. Oh, and grab those quick wins that multiple stakeholders mentioned first - builds good momentum for the bigger stuff later.

Set up a project repo with your data pipeline code (commented well), a methodology doc covering your approach and assumptions, and a findings summary with all your visuals. Honestly, the "lessons learned" section is clutch - you'll forget why you made half these decisions otherwise. Break your code into modules so it's not a nightmare for the next person. Version control everything, obviously. Oh and throw in sample datasets if you can swing it. Makes it way easier for someone else to jump in later without having to decode what the hell you were thinking.

So we're doing quarterly check-ins to fix any broken stuff and update dashboards when your needs change. You'll get alerts if data feeds start acting weird. Most people just ignore these systems until they break (learned that the hard way), but we're actually gonna stay on top of it. I'm documenting everything so your team can handle the basic updates without bugging us constantly. Budget around 10-15% of what you originally spent each year for maintenance. Should cover pretty much anything that comes up.

Ratings and Reviews

100% of 100
Review Form
Write a review
Most Relevant Reviews
  1. 100%

    by Dustin Perkins

    Great designs, really helpful.
  2. 100%

    by Damian Stevens

    I'm happy to discover your PowerPoint presentations and templates. They met my expectations precisely. Very innovative!

2 Item(s)

per page: