


Monthly Business Overview Powerpoint Presentation Slides






Try Before you Buy Download Free Sample Product
 Impress Your
 Audience
 100%
100% Editable
 Save Hours
 of Time


Scrutinize your business sales and growth with our monthly business overview PowerPoint presentation slides. It helps in ensuring the proper execution of the defined business strategic as well as the operating plans. This profitable Monthly Business review PPT design will portray the idea of business achievement however the methods for exact and effective business dissects measures. Apart from this, clarify different other components related with business review with our presentation template, for example, it helps in competent decision making, persuade employees to perform better, enhances client’s contentment rate, helps in achieving business objectives, gives new business opportunities, and so on. This business overview presentation is quite extensive and showcases monthly development rate of your company to the stakeholders and investors. This Monthly company Overview PowerPoint slides further helps in providing the accurate position of your business in the prevailing industry. Therefore, get this exclusive presentation layout and evaluate the performance of your organization structure. Our Monthly Business Overview Powerpoint Presentation Slides will fill in the gaps. They ensure everything is complete.
People who downloaded this PowerPoint presentation also viewed the following :
Content of this Powerpoint Presentation
Slide 1: This slide introduces Monthly Business Overview. State your company name and begin.
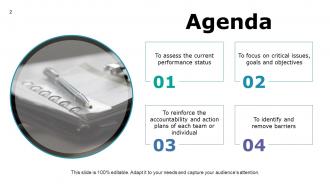
Slide 2: This is an Agenda slide. It has the following features- To assess the current performance status, To focus on critical issues, goals and objectives, To reinforce the accountability and action plans of each team or individual, To identify and remove barriers.
Slide 3: This slide showcases Table Of Contents. You can add the title and get started.
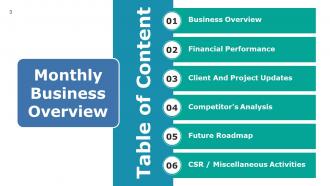
Slide 4: This is also a Table of Content slide. Use it to showcase the following- Business Overview, Financial Performance, Client And Project Updates, Competitor’s Analysis, Future Roadmap, CSR / Miscellaneous Activities.
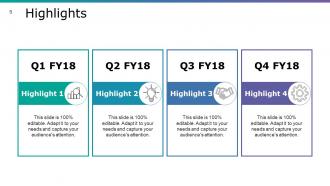
Slide 5: This is a Highlights slide with icon imagery to state.
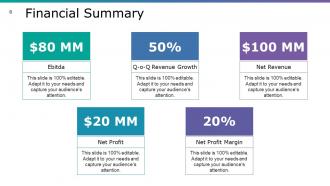
Slide 6: This is a Financial Summary slide. Use it to state financial aspects such as- Ebitda, Net Profit, Q-o-Q Revenue Growth, Net Profit Margin, Net Revenue.
Slide 7: This slide states Revenue Split - By Geography on a world map image.
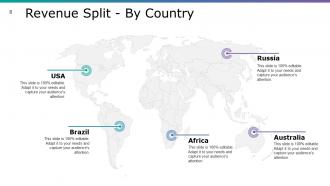
Slide 8: This slide states Revenue Split - By Country on a world map image.
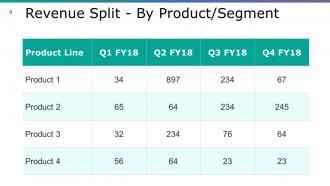
Slide 9: This slide states Revenue Split - By Product/Segment in a tabular form.
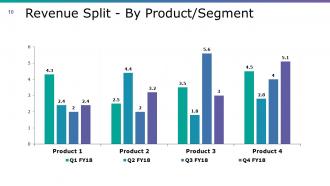
Slide 10: This slide also states Revenue Split - By Product/Segment in a bar graph/ chart form.
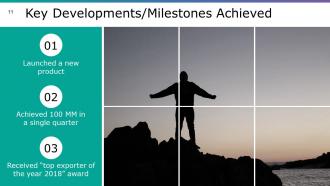
Slide 11: This slide showcases Key Developments/Milestones Achieved with imagery. Use it to state key developments or milestones achieved by your company such as- Launched a new product, Achieved 100 MM in a single quarter, Received “top exporter of the year 2018” award.
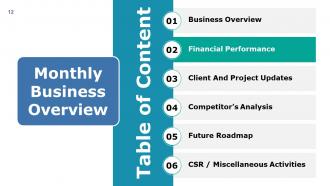
Slide 12: This slide also showcases Table of Content. Use it to show the following- Business Overview, Financial Performance, Client And Project Updates, Competitor’s Analysis, Future Roadmap, CSR / Miscellaneous Activities.
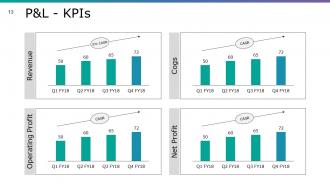
Slide 13: This is P&L - KPIs slide in a bar graph/ chart form.
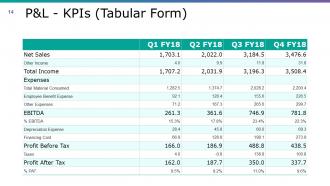
Slide 14: This slide also showcases P&L - KPIs in a tabular form.
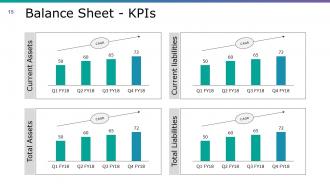
Slide 15: This slide shows the Balance Sheet - KPIs. The included subheadings are- Current Assets, Total Assets, Current Liabilities, Total Liabilities.
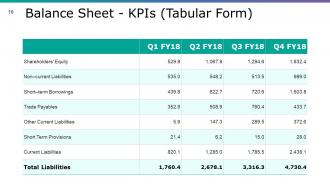
Slide 16: This slide shows the Balance Sheet - KPIs in a tabular form.
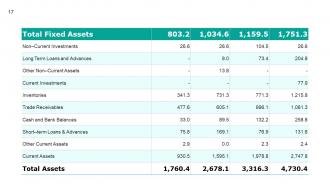
Slide 17: This slide states Total Fixed Assets in a tabular form.
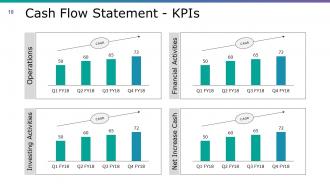
Slide 18: This slide shows Cash Flow Statement - KPIs in graph form. The constituents include- Operation, Investing Activities, Financing Activities, Net Increase In Cash.
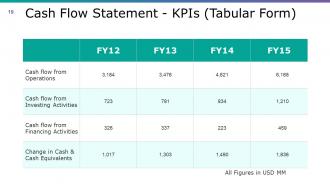
Slide 19: This slide presents Cash Flow Statement - KPIs in a Tabular Form.
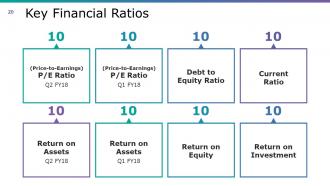
Slide 20: This slide states Key Financial Ratios such as- P/E Ratio, Debt to Equity Ratio, Current Ratio, Return on Investment, Return on Assets, Return on Equity.
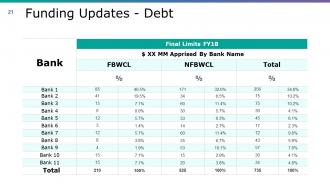
Slide 21: This slide presents Funding Updates - Debt in a tabular form.
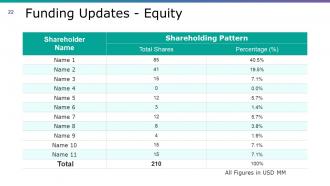
Slide 22: This slide showcases Funding Updates - Equity. Present data here in a tabular form.
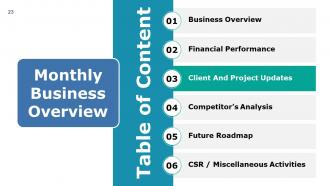
Slide 23: This slide is titled Table of Content to state.
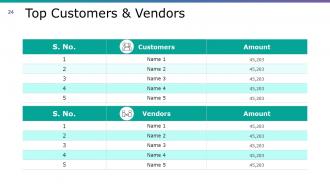
Slide 24: This slide showcases Top Customers & Vendors table. Use it to state your customers, vendors etc.
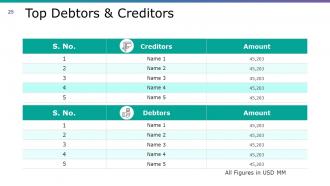
Slide 25: This slide showcases Top Debtors & Creditors in a tabular form. Use it as per your need.
Slide 26: This slide showcases Client Updates with respect to- Major Clients Acquired, New Clients Acquired.
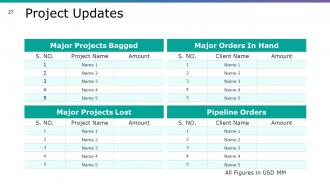
Slide 27: This is a Project Updates slide. Present your project related updates in a tabular form here.
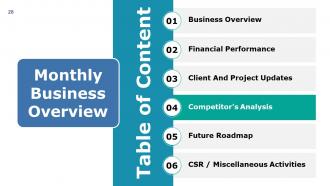
Slide 28: This slide presents Monthly Business Overview with Table Of Content. The points are- Business Overview, Financial Performance, Client and Project Updates, Competitor’s Analysis, Future Roadmap, CSR / Miscellaneous Activities.
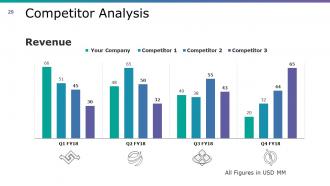
Slide 29: This slide showcases Competitor Analysis in a bar graph/ chart form.
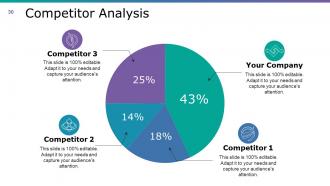
Slide 30: This slide shows Competitor Analysis showing Cost of Goods sold.
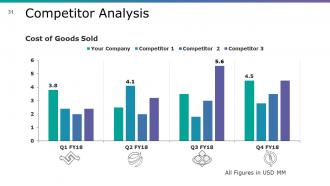
Slide 31: This slide also showcases Competitor Analysis in a bar graph/ chart form.
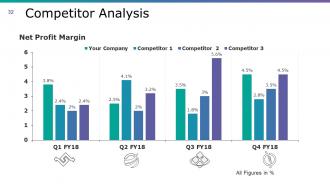
Slide 32: This slide presents Competitor Analysis showing Net Profit Margin.
Slide 33: This slide presents Benchmarking Competitive Intelligence Matrix in terms of Quality and High-Low parameters.
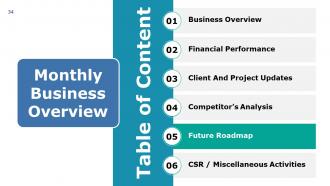
Slide 34: This slide displays Table of Content for Monthly Business Overview with the following- Business Overview, Financial Performance, Client and Project Updates, Competitor’s Analysis, Future Roadmap, CSR / Miscellaneous Activities.
Slide 35: This slide showcases 30-60-90 Day Plan. State it here.
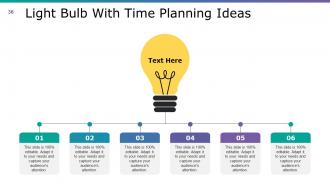
Slide 36: This slide showcases Light Bulb With Time Planning Ideas with imagery and text boxes.
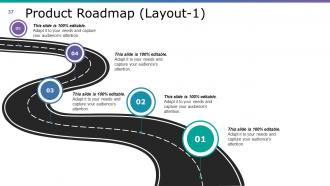
Slide 37: This slide showcases a Product Roadmap with imagery. Use it state milestones etc. here.
Slide 38: This is also a Product Roadmap slide. State milestones etc. here.
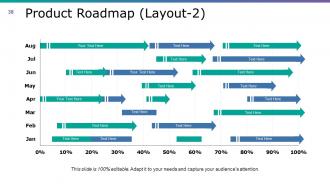
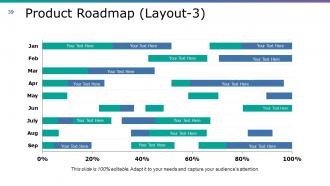
Slide 39: This slide also showcases a Product Roadmap in a Swimlane form. State milestones etc. here.
Slide 40: This slide shows Phases Of Implementation. State phases here.
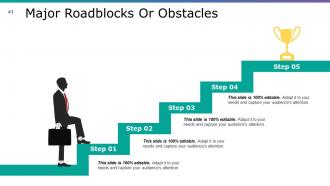
Slide 41: This slide states Major Roadblocks Or Obstacles in people silhouettes and text boxes to go with.
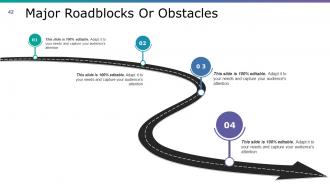
Slide 42: This slide also states Major Roadblocks Or Obstacles in a roadmap form.
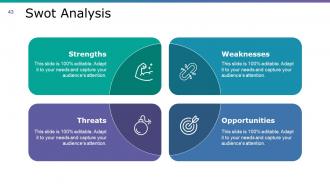
Slide 43: This slide states Swot Analysis with icon imagery and text boxes.
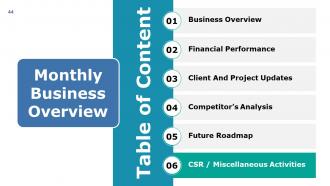
Slide 44: This slide showcases Table of Content for Monthly Business Overview. The contents are- Business Overview, Financial Performance, Client and Project Updates, Competitor’s Analysis, Future Roadmap, CSR / Miscellaneous Activities.
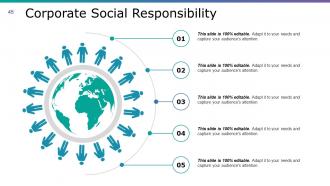
Slide 45: This slide states Corporate Social Responsibility with creative imagery and text boxes.
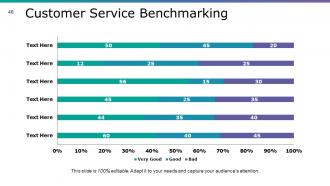
Slide 46: This slide shows Customer Service Benchmarking in terms of Very Good, Good, Bad in a graph form.
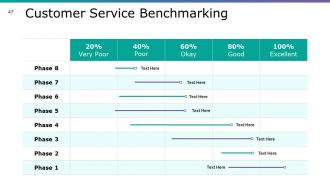
Slide 47: This slide shows another variation of Customer Service Benchmarking in terms of Very Good, Good, Bad.
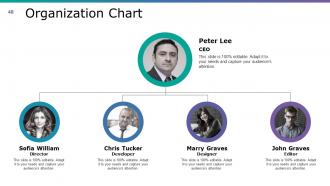
Slide 48: This slide showcases Organization Chart with name, designation etc. Use it to present the hierarchy of your organization.
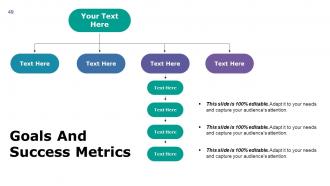
Slide 49: This is Goals And Success Metrics slide in a flow chart form. State them here.
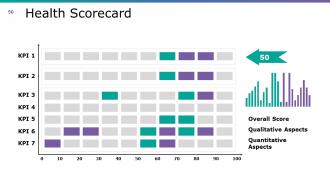
Slide 50: This is a Health Scorecard slide showing- Overall Score, Qualitative Aspects, Quantitative Aspects.
Slide 51: This is a Coffee Break image slide to halt. You can change the slide content as per need.
Slide 52: This slide is titled Charts & Graphs for moving forward. You can change the slide content as per need.
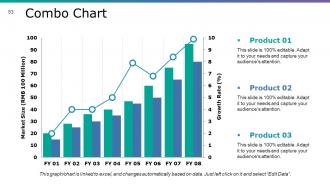
Slide 53: This is a Combo Chart slide to show information, comparison specifications etc.
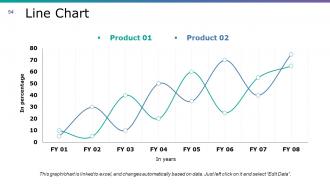
Slide 54: This slide presents a Line Chart for showcasing product/company growth, comparison etc.
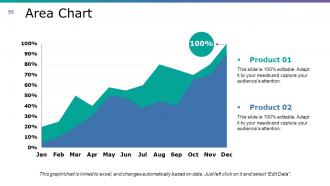
Slide 55: This slide presents an Area Chart graph for showcasing product/ company growth, comparison etc.
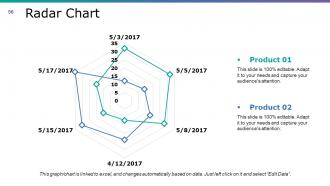
Slide 56: This is a Radar Chart slide to show product/ entity growth, comparison etc.
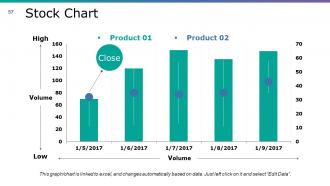
Slide 57: This is a Stock Chart to show product/entity growth, comparison etc.
Slide 58: This slide is titled Additional Slides to move forward. You can change the slide content as per need.
Slide 59: This is Our Mission slide. State company mission here.
Slide 60: This is an About Us slide. State team/ company specifications here.
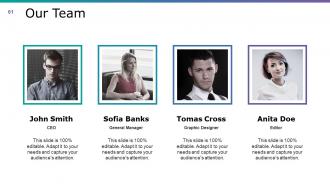
Slide 61: This is an Our Team slide with name and designation.
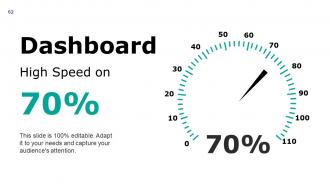
Slide 62: This slide displays a Dashboard with metric imagery. You can present kpis, metrics etc. here.
Slide 63: This is a Post It slide. Pin your text here.
Slide 64: This is Puzzle Pieces slide to show information, specifications etc.
Slide 65: This is Target image slide to show information, specifications etc.
Slide 66: This is a Circular image slide to show information, specifications etc.
Slide 67: This is a Venn diagram image slide to show information, specifications etc.
Slide 68: This slide shows a Mind map for representing entities.
Slide 69: This is a Lego box image slide to show information, specifications etc
Slide 70: This is a Silhouettes infographic slide to show information, specifications etc.
Slide 71: This is a Magnifying Glass image slide to show information, specifications etc.
Slide 72: This is a Thank You slide with Address# street number, city, state, Contact Numbers, Email Address.
Monthly Business Overview Powerpoint Presentation Slides with all 72 slides:
Counter external influences with our Monthly Business Overview Powerpoint Presentation Slides. Ensure they don't adversely effect your enterprise.








FAQs for Monthly Business Overview
So for your business overview, definitely include your mission, what you actually sell, and who you're selling to. Your competitive edge too - like what makes you different from everyone else doing similar stuff. Think of it as your elevator pitch but written down. Someone should get your company within like 30 seconds of reading. Throw in some company background, where you stand now, and future plans. Oh and don't skip the team stuff - people invest in people, you know? One page tops though. Nobody's reading a novel about your startup.
Your business overview really depends on what industry you're in. Tech companies obsess over innovation and how they'll scale up, but manufacturing? They care more about efficiency and supply chains. Finance and healthcare have to deal with all that regulatory stuff upfront - honestly such a pain but investors expect it. Retail focuses on customer experience, while B2B services talk up their client relationships. Short version: figure out what matters most to investors in your specific field and hit those points hard. Don't waste time on generic fluff that doesn't move the needle for your audience.
Honestly, good design makes or breaks these things. People zone out instantly if your slides look messy or boring. Stick to clean layouts and maybe 2-3 colors tops - trust me on this one. Charts beat paragraphs every single time for showing data. I've sat through way too many presentations that looked like someone just copy-pasted from Word. Pick a simple template and don't overthink it. The visuals should help tell your story, not compete with it. Also, consistent fonts matter more than you'd think.
Okay so basically you gotta figure out what each group actually cares about first. Investors? They want numbers - growth rates, ROI, that stuff. But customers just want to know you'll fix their problems. It's kinda like switching up your dating profile depending on the app, honestly. Make 2-3 different versions of your pitch. Lead with whatever matters most to that specific audience. So if you're talking to potential partners, open with your market position instead of burying it halfway through. Then test them out and see which ones actually work. Don't just guess what people want to hear - most of us are pretty bad at that.
Ugh, the worst thing you can do is dump every single detail on people - like seriously, nobody cares about your third-tier product features. Focus on the big picture: what problem you're solving and who you're helping. Don't be that person who just reads bullet points off slides (we've all sat through those snoozefests). Make it visual, practice your timing beforehand, and honestly? Always end with what you actually want from them. Oh, and skip the jargon - talk about your competitive edge in normal human words. People zone out fast if you sound like a manual.
Quarterly updates work as a baseline, but don't be rigid about it. New product launches? Market shifts? Competitive stuff happening? Update it right away. I've watched teams confuse the hell out of stakeholders because they were still using some ancient overview from like 8 months ago. Super awkward in meetings when nothing lines up. Set those calendar reminders every three months, then just stay flexible. Your overview needs to match what's actually happening now, not what you thought might happen back in January. Short version: schedule it quarterly, but update whenever reality changes.
Start with the basics - revenue, profit margins, and cash flow. Those three will tell you everything about whether your business is actually healthy. Growth rate matters a ton too, depending on where you are (monthly vs yearly). Oh, and if you've got customers coming back or paying subscriptions, track acquisition cost and lifetime value - seriously, investors eat that stuff up. Burn rate's obviously crucial if you're fundraising. But honestly? Don't go crazy with metrics. Pick like 4-5 that actually matter for your situation and know why each one's important.
Look, storytelling is everything for business overviews. Don't just list features - people's eyes glaze over. Instead, start with whatever problem made you think "screw this, I'm fixing it myself." Walk them through your journey, maybe mention a setback or two (makes you relatable). Stories stick in people's heads way better than boring bullet points anyway. Oh, and skip the corporate speak. Try something like "Last year we realized customers were getting totally screwed by..." rather than jumping straight into product benefits. End with your vision - where you're going next. Trust me, it'll feel way more human and actually get people interested.
Honestly, just grab Canva if you want something quick and clean - it's way more intuitive than people think. Grammarly's solid for catching typos and weird phrasing. I've been using ChatGPT lately to brainstorm when my brain's totally blank, which happens more than I'd like to admit lol. PowerPoint still works fine for presentations, or Prezi if you want to get fancy. Figma's cool too if other people need to jump in and edit. My take? Don't overthink it. Pick one design thing, one writing tool, then just dive in. You can always mess with it later once you see how it looks.
So online presentations need way more visuals and interaction since people zone out staring at screens. Break up text across more slides, throw in polls, pause for questions every few minutes. In-person is totally different though - you can actually read faces and go off-script. Honestly my best pitches happened when I scrapped half my slides halfway through and just talked. With online you need that structured engagement every 3-5 minutes or you'll lose them. In-person flows naturally. Oh, and make two versions of your deck because they're really that different.
Your business overview probably feels kinda empty right now because you're missing that competitive context. Pick 3-5 direct competitors and sprinkle those comparisons throughout instead of dumping them in one section. This helps you figure out what makes you different and where you actually fit in the market. Honestly, investors eat this stuff up - they want to see you understand the playing field. You'll spot gaps you're filling and get real about your strengths vs weak spots. Way more compelling than just describing what you do in isolation.
Dude, this stuff matters way more than people think. Japanese clients want to see your whole company hierarchy laid out formally - credentials first, then everything else. Germans? Hit them with hard data and technical details right away. Americans are all about that big vision energy and growth stories. Latin American markets care about your values and community ties before they'll even look at your numbers. You can't just slap a translation on your usual pitch and expect it to work. What kills it in New York might totally bomb in Seoul, so you gotta research each culture's communication style and flip your whole approach.
You definitely want your branding to stay consistent across all your business templates. Colors, fonts, logos - keep them matching everywhere. It builds trust and makes you look way more professional than if everything's all over the place. Honestly, inconsistent branding screams "amateur hour" to potential clients. When everything matches, people start recognizing your stuff instantly (kind of like how you'd spot a Starbucks from miles away). Just make a basic brand guide with your main elements and actually stick to it. I know it sounds boring, but it's one of those things that really pays off when you're consistent about it.
Honestly, charts and graphs are game-changers for business presentations. Nobody wants to sit through slides packed with text and numbers - your audience will zone out in like 30 seconds. When you show data visually, people actually get it right away. Trends jump out, comparisons become obvious, and you don't have to explain every little detail. It makes you look way more professional too. My old boss used to love cramming everything into bullet points, but visuals just hit different. Try swapping out three of your data-heavy bullet points for simple charts next time. You'll see the difference immediately.
Honestly, market positioning is like the backbone of your whole business story. You gotta nail that down first or everything else falls apart. Premium brand? Your overview should scream quality and exclusivity. Going budget-friendly? Focus on being accessible and good value. It's literally the lens people use to see your business - sounds cheesy but it's true. Without solid positioning, you end up with some bland, generic mess that nobody cares about. I learned this the hard way tbh. Figure out where you sit in the market, then let that drive how you tell your story.
-
I discovered this website through a google search, the services matched my needs perfectly and the pricing was very reasonable. I was thrilled with the product and the customer service. I will definitely use their slides again for my presentations and recommend them to other colleagues.
-
Wonderful templates design to use in business meetings.