


Yearly business plan report powerpoint presentation slides


Try Before you Buy Download Free Sample Product
 Impress Your
 Audience
Editable
of Time


Introducing Yearly Business Plan Report Powerpoint Presentation Slides. With the help of this business operating plans PPT template, an organization can strategize the yearly target which has to be achieved by their employees. You can brief about the various factors like financial highlights, key performance indicators, team management, and many more by using our professionally designed yearly business plan report PowerPoint presentation complete deck. Create a time management record with the help of a business plan report PPT template and attain your target within a specified time-frame. This operating strategy PowerPoint presentation complete deck comprises of a total of forty-one slides. Integrated business planning PPT visual contains exclusive diagrams and high-rated icons with which you can make your presentation more engaging. The annual business development strategy PowerPoint presentation template is majorly used in corporate sectors, private sectors, start-ups, firms, organizations, etc. Therefore, download this ready-to-use business operating plan PPT slides and focus on fulfilling your yearly targets.
People who downloaded this PowerPoint presentation also viewed the following :
Content of this Powerpoint Presentation
Slide 1: This slide introduces Yearly Business Plan Report. State Your Company Name and begin.
Slide 2: This slide presents Agenda. Add your agenda and use it.
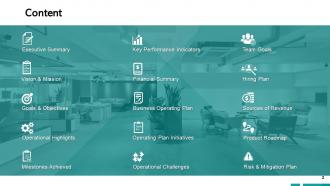
Slide 3: This slide presents Content which further showcases Executive Summary, Vision & Mission, Goals & Objectives, Operational Highlights, Milestone Achieved, Key Performance Indicator, Financial Summary, Operational Challenges, Operating Plan Initiatives, Business Operating Plan, Team, Goals, Hiring, Plan, Success of Revenue, Product Roadmap, Risk & Migration Plan.
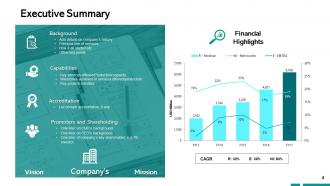
Slide 4: This slide presents Executive Summary describing- Background, capabilities, Accreditation, promoters and shareholders.
Slide 5: This slide displays Our Vision and Mission with related imagery and text.
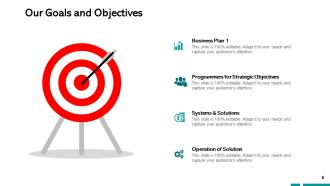
Slide 6: This slide presents Our Goals and Objectives with these of the following stages- Business Plan, System and Solutions, Programmers for Strategic Objectives, Business Plan, Operation of Solution.
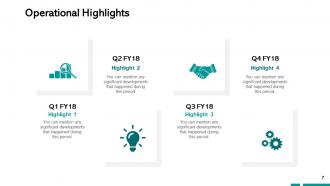
Slide 7: This slide represents Operational Highlights in a timeline form.
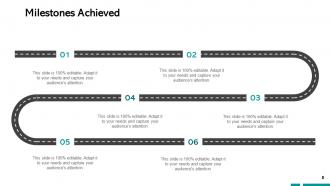
Slide 8: This slide showcases Milestones Achieved with text boxes.
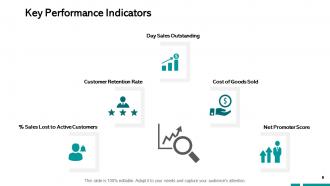
Slide 9: This slide presents Key Performance Indicators which further showcases- Cost of Goods Sold, Net Promoter Score, % Sales Lost to Active Customers, Customer Retention Rate, Day Sales Outstanding.
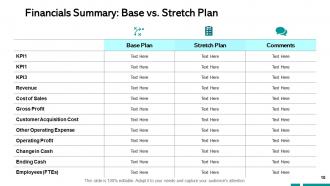
Slide 10: This slide shows Financials Summary: Base vs. Stretch Plan.
Slide 11: This slide presents Financials Summary: Base Plan.
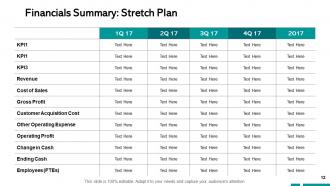
Slide 12: This slide represents Financials Summary: Stretch Plan.
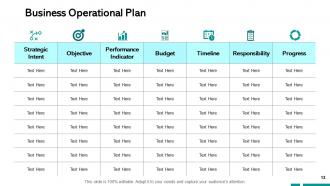
Slide 13: This slide displays Business Operational Plan with categories as- Strategic intent, Objective, performance indicator, Budget, Timeline etc.
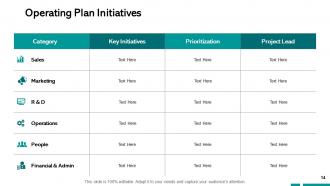
Slide 14: This slide showcases Operating Plan Initiatives in a tabular form with categories, Key initiatives, Prioritization and project leads.
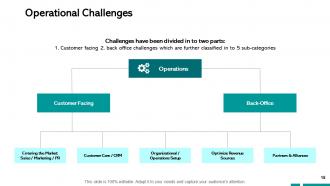
Slide 15: This slide is titled as Operational Challenges which further showcases- Customer Facing, Back-Office, Operations, Entering the Market, Sales / Marketing / PR, Customer Care / CRM, Partners & Alliances, Organizational / Operations Setup, Optimize Revenue Sources.
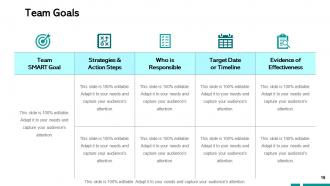
Slide 16: This slide shows Team Goals with a table for different areas.
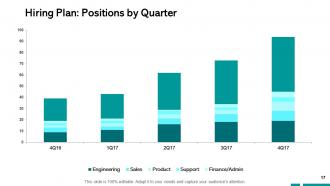
Slide 17: This slide presents Hiring Plan: Positions by Quarter in a graph form with categories as- Finance, support, product and marketing.
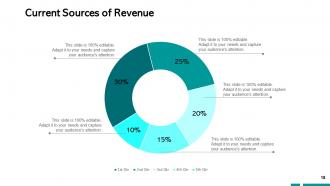
Slide 18: This slide shows Current Sources of Revenue with additional text boxes.
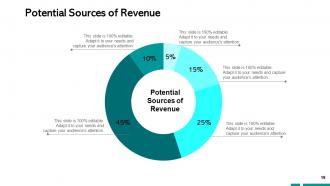
Slide 19: This slide presents Potential Sources of Revenue with the help of pie chart.
Slide 20: This slide displays Product Roadmap with text boxes to show information.
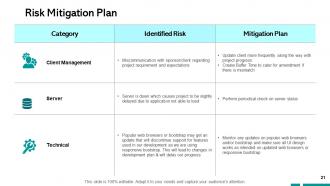
Slide 21: This slide represents Risk Mitigation Plan with Category, Identified risk and mitigation plan.
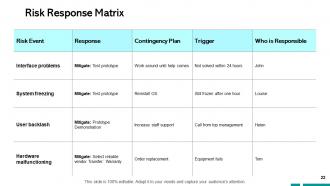
Slide 22: This slide showcases Risk Response Matrix with categories as- Risk event, response, trigger etc.
Slide 23: This slide displays Yearly Business Plan Report Icons.
Slide 24: This slide reminds about 10 Minutes Coffee break.
Slide 25: This slide is titled as Additional Slides for moving forward.
Slide 26: This is Our Team slide with names and designation.
Slide 27: This is About Us slide to show company specifications etc.
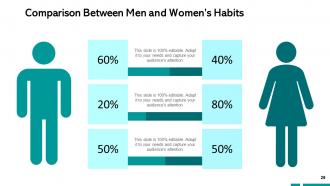
Slide 28: This is a Comparison slide to state comparison between commodities, entities etc.
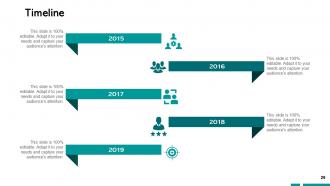
Slide 29: This is a Timeline slide. Show information related time period here.
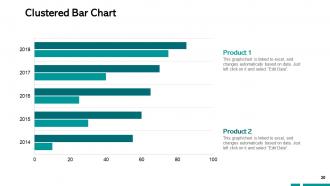
Slide 30: This slide showcases Clustered Bar Chart with two products comparison.
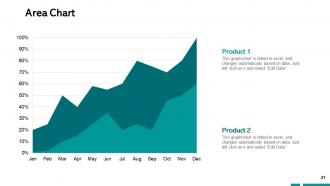
Slide 31: This slide shows Area Chart with two products comparison.
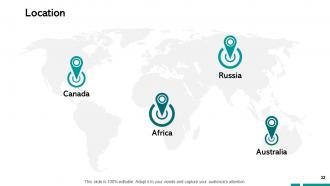
Slide 32: This is a Location slide with maps to show data related with different locations.
Slide 33: This is a Financial slide. Show your finance related stuff here.
Slide 34: This slide shows Mind Map for representing entities.
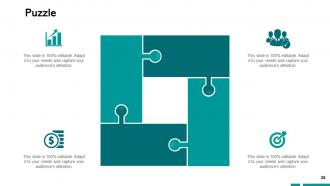
Slide 35: This is a Puzzle slide with text boxes to show information.
Slide 36: This slide displays Creative Idea to state a new idea and creative idea.
Slide 37: This is a Quotes slide to highlight or state anything specific.
Slide 38: This is a Venn slide with text boxes.
Slide 39: This slide displays Post it. Post your important notes here.
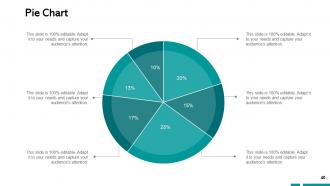
Slide 40: This slide shows Pie Chart with data in percentage.
Slide 41: This is a Thank You slide with address, contact numbers and email address.
Yearly business plan report powerpoint presentation slides with all 41 slides:
Demonstrate care for their comfort with our Yearly Business Plan Report Powerpoint Presentation Slides. Your genuine concern will get across.


FAQs for Yearly business plan report
So you'll need five key sections: executive summary, how you did against targets, market stuff, operational wins, and next year's goals. Honestly, most execs only read the summary anyway, so nail that part. Include your successes AND failures - nobody believes a perfect year happened. Back everything up with actual numbers, not fluff. For things that didn't work, explain why (that's the good stuff leadership wants). Oh, and don't just dump data on them. Tell the story behind your results. Wrap up with concrete goals that have real deadlines attached.
Pick 3-5 metrics that actually move the needle - revenue growth, customer acquisition costs, stuff like that. Skip the endless spreadsheets and go straight for visual dashboards. Year-over-year trends work way better than random static numbers. Oh, and always explain weird dips or spikes with quick context like "supply chain mess in Q3." Executives zone out fast, so honestly less is more here. Don't just show the wins either - call out problem areas too. One summary slide with your biggest takeaways and you're golden.
Hey! So for your business plan, definitely grab your financial stuff first - revenue, expenses, all that from your accounting software. Sales reports are gold for spotting trends. Customer surveys tell you what people actually think (sometimes brutally honest lol). I always snoop on competitors' websites too - don't feel bad about it, everyone does. Your team meetings probably have useful operational data hiding in there. Oh, and industry reports if you can find decent ones. Honestly, just dump everything into a spreadsheet as you go. Makes writing the actual plan less of a nightmare later.
So you'll want a whole section on market trends - both what's happening now and what's coming in the next year or so. Customer behavior changes, what competitors are doing, industry shifts, all that stuff. But here's the thing - don't just dump a list of trends like you're writing an encyclopedia entry. That's boring as hell. Connect each one to your actual business strategy and show how you plan to adapt or take advantage. Be honest about which trends are real opportunities vs just hype. The goal? Prove you're not just watching from the sidelines but actually have a game plan.
Look, SWOT analysis is basically your reality check before you start dreaming up next year's goals. You're mapping out strengths, weaknesses, opportunities, and threats - sounds boring but it's actually clutch. Most people blow through this step way too fast though. Be ruthless about your weaknesses and threats, even if it stings a little. Those insights end up driving everything else - where you put your money, what risks you need to watch out for, your whole strategic game plan. Sugar-coating stuff here will just mess you up later when you're wondering why your projections were so off.
Honestly, charts and graphs are a game changer for business plans. People's eyes just glaze over when they hit paragraphs full of numbers and projections. Bar charts work great for comparing revenue, pie charts break down market share nicely. Timelines are perfect for showing your roadmap too. When you're presenting, stakeholders can spot trends immediately instead of trying to decode your data. Oh, and clean labels are key – I've seen so many messy charts that just confuse everyone. Visual stuff sticks in people's minds way better than text blocks.
Dude, the worst thing you can do is be ridiculously optimistic - like assuming zero problems will happen. I've watched so many people crash and burn that way. Also don't drown everyone in data without actually saying what it means. Nobody cares about last year's recap anyway; they want to know what you learned and what's changing. Oh, and please skip the buzzword soup that makes everything sound identical. Your math better actually add up too - I can't tell you how many reports have financial assumptions that make zero sense. Keep it real and actionable.
So here's the thing - your yearly report can't just be random data thrown together. Map everything back to those big 3-5 year goals you set. Like, if you're trying to expand markets, focus heavily on customer acquisition numbers and where you're growing geographically. I've watched so many teams just list what happened without explaining why it matters (honestly drives me crazy). Show how this year's wins actually move the needle toward your long-term targets. Think of it as checking your GPS mid-road trip. You're not just documenting the drive - you're proving you're headed in the right direction.
Think of clear objectives like your business GPS - they show you where you're headed and whether you're actually making progress. Without them, you're basically throwing money at stuff and hoping it works (trust me, I've watched companies do this). Your team stays focused instead of wandering off on random projects. Come quarterly review time, you'll have real numbers to show instead of just saying "yeah, we did alright I guess." Honestly, the difference is night and day. Start with 3-5 specific goals that connect directly to revenue or growth targets.
Start with what actually moves the needle - revenue growth, profit margins, cash flow, debt ratios. Ditch the accounting jargon though. Your CEO doesn't want to decode what "EBITDA margin optimization" means. Show trends, not just static numbers. Where are things heading? Charts help too since most people are visual learners. Oh, and don't try hiding the bad stuff - call out problems directly with your fix-it plan. I've seen too many reports that dance around issues. Being straight about challenges actually makes you look more credible than pretending everything's perfect.
Start with your biggest wins - revenue bumps, major clients, product launches. Numbers are key since execs eat that stuff up. Then explain what actually drove those results, like which strategies clicked or team moves that paid off. Honestly, being selective here is way better than dumping everything you did. Keep each win to 2-3 sentences and always tie it back to business impact. Oh, and definitely wrap up each section with what you learned - it sets you up nice for next year's planning conversations.
Honestly, forecasting is kinda like educated guesswork half the time - but here's what actually works. Start with your past 3-5 years of financial data to spot patterns and seasonal stuff. Then research current market trends and make realistic assumptions about growth, costs, all that. The trick is creating three scenarios: best case, worst case, and most likely outcome. That way you're not just throwing out one random number. Oh, and definitely write down your key assumptions somewhere - stakeholders always want to know how you got there. I'd tackle the historical data first, then build everything else around it.
Make it interactive instead of just throwing data at people. Executive summaries work great for busy folks. Visual dashboards are your friend - way better than walls of text. Tailor different versions for different audiences since board members care about totally different stuff than department heads do. Don't just email it out (seriously, nobody reads those). Host quick presentation sessions where they can ask questions. Some people learn better from video summaries too, which sounds weird but actually works. The key thing though? Connect everything to actual decisions they need to make. Give them clear next steps they can run with.
Dude, your yearly report doesn't have to be a snoozefest! Try Tableau or Power BI to turn those spreadsheets into actual visual stories. Way better than staring at endless numbers. Prezi works great too, or just grab some decent PowerPoint templates – anything's better than walls of text. Interactive dashboards are clutch because people can click around and find what they actually care about. I learned this the hard way after watching executives zone out during my first presentation. Start with one tool and focus on your biggest metrics. You'll be shocked how much more people pay attention when there's something visual to look at.
Look at last year's feedback first - that's your cheat sheet for what actually worked. Check which goals you nailed vs the ones that were way too optimistic, then tweak your targets. Comments from stakeholders usually show you stuff you totally missed, like maybe you didn't see that market change coming or you thought your team could handle more than they could. Oh, and if people said your metrics were confusing last time, make sure you're clearer about your KPIs this year. Honestly? The complaints are gold because they tell you exactly what needs fixing. Use all that to build your new strategy.
No Reviews