


Business Overview Module Powerpoint Presentation Slides






Try Before you Buy Download Free Sample Product
 Impress Your
 Audience
 100%
100% Editable
 Save Hours
 of Time


If you want to give presentation to stakeholders or board of directors about your business offer or achievements, then we have the perfect solution to portray all your success stories with our business overview module PowerPoint presentation slides. This PPT theme has been designed by our team of experts and allows you to use multiple PowerPoint templates which have been crafted around your requirements. This Business Overview Module PPT deck of business overview can be used to convey multiple messages such as to portray your achievements, about your team, your geographical reach, presence in different states or countries, your dominance in different products and their different varieties, analysis of business projects, vision and mission statements. This business general idea presentation template is useful to show your agenda, company’s overview, hierarchical tree of the business, expert team members, and export and import analysis or about us and different comparisons and investigations. Download this Business Overview Module presentation templates to leverage your business overview to your clients. Folks feel driven to be inventive due to our Business Overview Module Powerpoint Presentation Slides. It awakens their inherent ingenuity.
People who downloaded this PowerPoint presentation also viewed the following :
Content of this Powerpoint Presentation
Slide 1: This slide introduces Business Overview Module. State your company name here and begin.
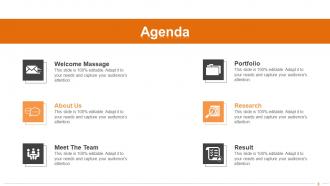
Slide 2: This slide states company Agenda with the following points- Meet The Team, About Us, Welcome Massage, Result, Research, Portfolio.
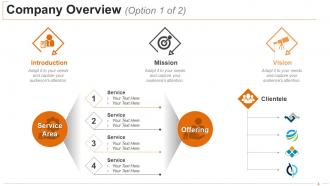
Slide 3: This slide presents Company Overview which includes- Introduction, Mission, Vision.
Slide 4: This slide also shows Company Overview with the following- Background, Capabilities, Accreditation, Company’s Vision, Company’s Mission.
Slide 5: This is Our Vision And Mission slide with icons. State company vision, mission etc. here.
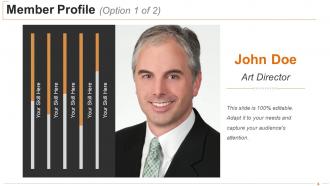
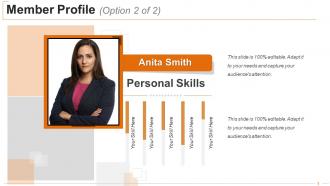
Slide 6: This slide presents Member Profile with name, designation, image etc. to fill.
Slide 7: This slide too showcases Member Profile to be filled as per requirement.
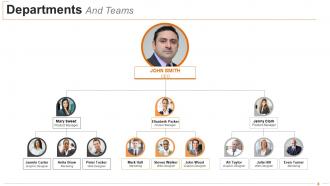
Slide 8: This slide states Departments And Teams with name, designation etc. in a flow chart form.
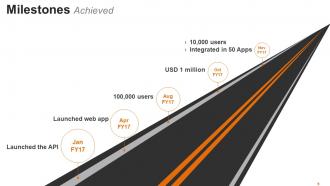
Slide 9: This slide states various Milestones Achieved by the company.
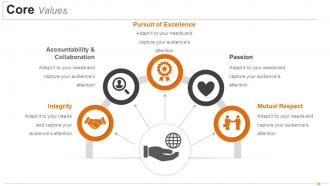
Slide 10: This slide displays Core Values which include- Pursuit of Excellence, Passion, Mutual Respect, Accountability & Collaboration, Integrity.
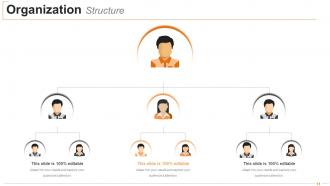
Slide 11: This slide showcases Organization Structure in a flow chart form.
Slide 12: This slide presents Our Team with name, designation, primary responsibilities etc. to fill.
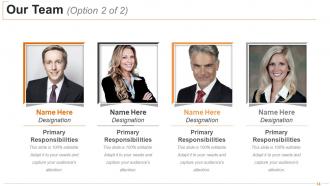
Slide 13: This slide too introduces Our Team.
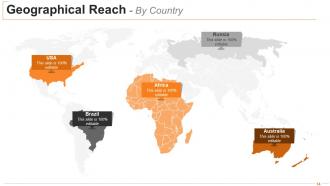
Slide 14: This is a Geographical Reach slide to present geographical growth, presence etc. on a world map image.
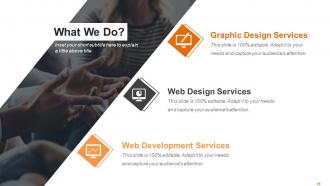
Slide 15: This is What We Do slide to present business services provided.
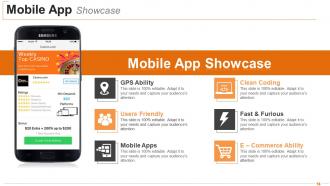
Slide 16: This is Mobile App slide showcasing the following- GPS Ability, Users Friendly, Mobile Apps, Clean Coding, Fast & Furious, E & dash; Commerce Ability.
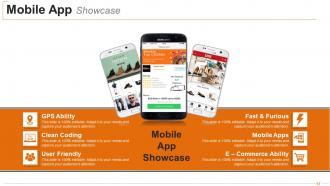
Slide 17: This slide too showcases Mobile App with relevant imagery.
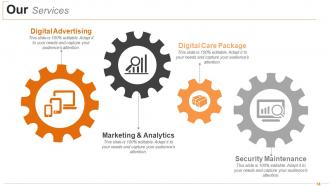
Slide 18: This slide presents Our Services which includes- Digital Advertising, Marketing & Analytics, Security Maintenance, Digital Care Package.
Slide 19: This slide is titled Press & Media Coverage with imagery. Change/ edit content as per need.
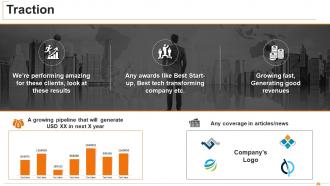
Slide 20: This is a Traction slide with icon imagery, company logo etc.
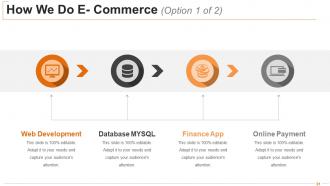
Slide 21: This is How We Do E- Commerce slide. The process includes- Web Development, Database MYSQL, Finance App, Online Payment.
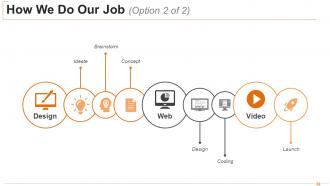
Slide 22: This is How We Do Our Job slide.
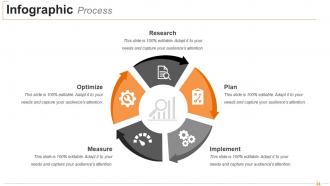
Slide 23: This is an Infographic Process slide which includes- Research, Plan, Implement, Measure, Optimize.
Slide 24: This is a Coffee Break image slide for a halt. Change/edit as per need.
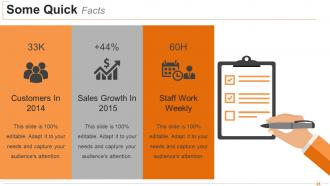
Slide 25: This slide states Some Quick Facts. Mention your facts, stats etc. here.
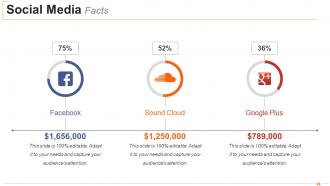
Slide 26: This is Social Media Facts slide with their respective icons.
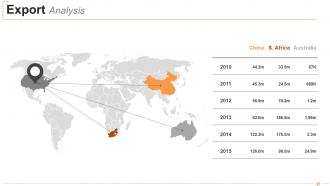
Slide 27: This slide showcases Export Analysis in a world map image form.
Slide 28: This is Icons Slide for Business Overview Module. Use/ add icons as per your business requirement.
Slide 29: This slide is titled Additional Slides to move forward. You can change the slide content as per need.
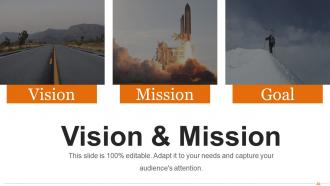
Slide 30: This is a Vision & Mission slide. State company mission, vision and goals here.
Slide 31: This slide showcases Our Team with Name and Designation to fill.
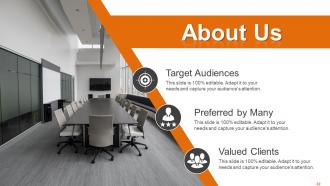
Slide 32: This is an About Us slide. State company or team specifications here.
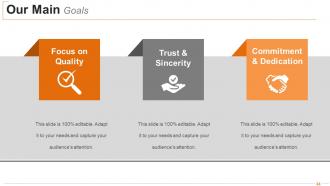
Slide 33: This slide states Our Main Goals which include- Commitment & Dedication Trust & Sincerity Focus on Quality. Add your own goals here.
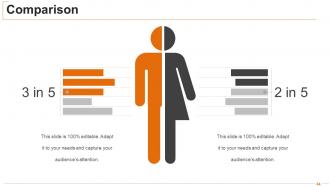
Slide 34: This slide shows Comparison of two entities in creative imagery form.
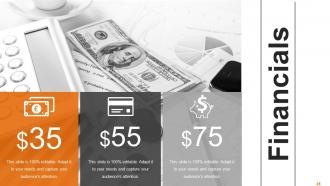
Slide 35: This slide is titled as Financials with imagery. Show finance related stuff here.
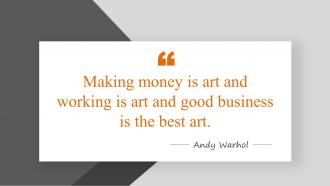
Slide 36: This is a business Quotes slide to quote something you believe in. You can change the slide content as desired.
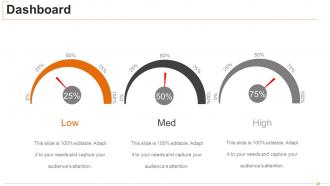
Slide 37: This is a Dashboard slide to state metrics, kpis etc. with High, Medium and Low parameters.
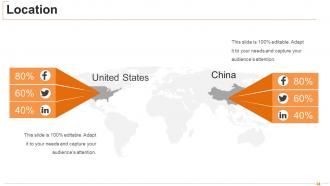
Slide 38: This is a Location slide of world map image to show global presence, growth etc.
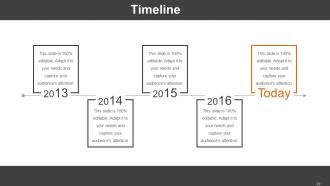
Slide 39: This is a Timeline slide to show milestones, growth highlights etc.
Slide 40: This is a Post it slide to state anything important, specific etc.
Slide 41: This slide presents a Newspaper image with text boxes to flash company news, position etc.
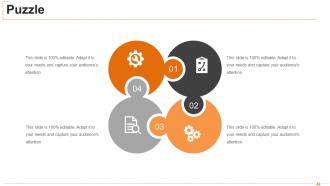
Slide 42: This is a Puzzle image slide to show information, specifications etc.
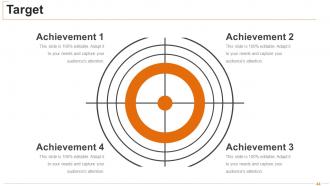
Slide 43: This is a Target image slide to state your achievements etc. here.
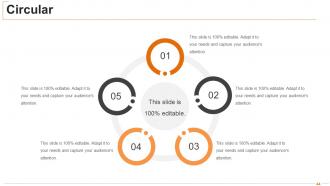
Slide 44: This is a Circular image slide to show information, specifications etc.
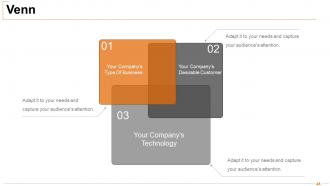
Slide 45: This slide displays Venn diagram image with- Your Company's Technology, Your Company's Desirable Customer, Your Company's Type Of Business.
Slide 46: This is a Mind Map slide. State information, specifications, segregation here.
Slide 47: This is a Matrix slide to show specific factors, comparison etc.
Slide 48: This is a Lego image slide to show information, specifications etc.
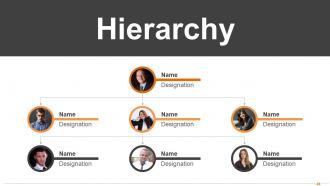
Slide 49: This is a Hierarchy chart slide to showcase team information, specifications etc.
Slide 50: This is a Silhouettes slide to show people related information, specifications etc.
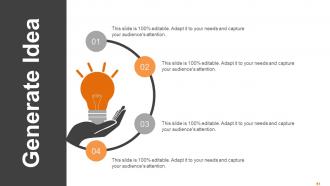
Slide 51: This is a Generate Idea slide to show information, specifications, innovative aspects etc. with relevant imagery.
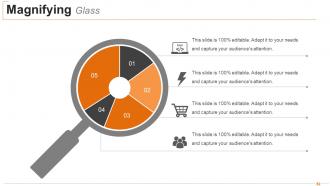
Slide 52: This is a Magnifying glass image slide to show information, specifications etc.
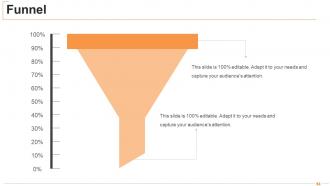
Slide 53: This is a Funnel image slide to show information, specifications etc. in a funnel form.
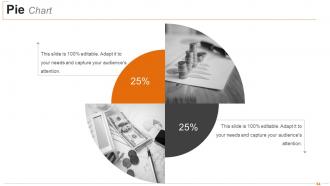
Slide 54: This is a Pie Chart slide to show product comparison etc.
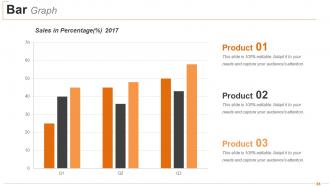
Slide 55: This is Bar Graph/ chart image slide to state a comparison between Product 01, Product 02, Product 03. Use as per requirement.
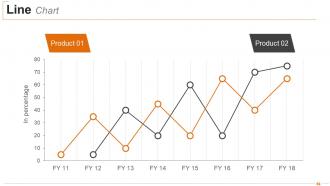
Slide 56: This is a Line Chart to present product/entity comparison, specifications etc.
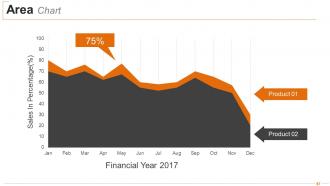
Slide 57: This is an Area Chart slide stating Product 01, Product 02 comparison. Use as per need.
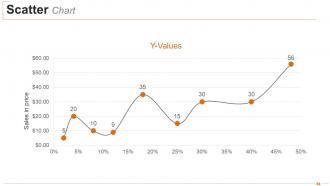
Slide 58: This is a Scatter Chart to present product/entity comparison, specifications etc.
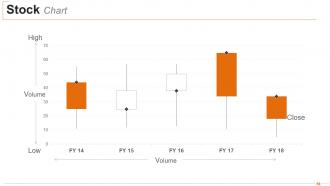
Slide 59: This is a Stock Chart slide to show product comparison in terms of high and low.
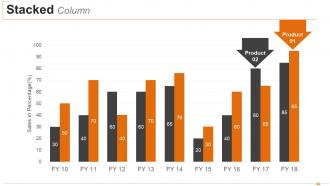
Slide 60: This is a Stacked Column Chart to show product/entity growth, comparison.
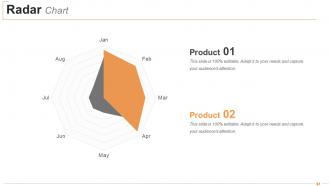
Slide 61: This is a Radar Chart slide for product/entity comparison.
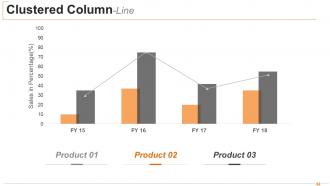
Slide 62: This is a Clustered Column-Line chart slide to showcase product/ entity growth, comparison etc.
Slide 63: This is a Contact Us slide with Address# Street Number, City, State, Email Address, Contact Number.
Slide 64: This is a Thank You slide for acknowledgement.
Business Overview Module Powerpoint Presentation Slides with all 64 slides:
Add to your array of accomplishments with our Business Overview Module Powerpoint Presentation Slides. Increase the feathers in your cap.










FAQs for Business Overview Module
Okay so definitely cover your mission/what problem you're solving, plus your main products and who buys them. Competitive advantages are huge - like what actually makes you different? Also throw in some financial wins or growth numbers if you've got them. Oh and introduce your team, people care about that more than you'd think. Honestly the structure part always trips me up too, but try to keep each bit short since everyone zones out. Practice how you'll move between sections beforehand - that's where most people sound super awkward. You want them walking away actually understanding what you do and why you're not gonna fail spectacularly.
Templates are honestly a game changer for this stuff. They make you actually think through what you're trying to accomplish instead of just winging it. Like when there's a "Problem Statement" section, you can't just skip over defining the actual issue, you know? Your team will thank you too since they'll always know where to find the important details. I've sat through way too many rambling presentations where nobody could figure out the point afterward - it's painful. Oh, and definitely include spots for your timeline and how you'll measure success. Those sections alone will save you from so many follow-up questions later.
Focus on the real problems you're solving and why now is the right time. Regulations matter too - investors always dig into compliance stuff eventually, so just get it out there upfront. For competitors, don't say you have none (eye roll), but cover who you're actually up against and what people use instead. The metrics part is huge though - research what numbers companies like yours typically show investors. CAC, churn, unit economics, whatever fits your model. Honestly, this research step alone will save you from looking clueless in meetings.
Who you're talking to changes everything about your presentation. Investors want to see market opportunity and money stuff upfront. But customers? They care about what problem you're solving for them. Internal people need the nitty-gritty operational details. I've watched so many pitches crash and burn because someone used the exact same deck for totally different audiences - it's painful to watch. You've got to speak their language and hit what matters to them first. Before you even open PowerPoint, figure out what this specific group actually cares about most.
Dude, you absolutely need visuals for your data. Spreadsheets are brutal - people's eyes just glaze over instantly. Charts and graphs make everything click way faster. Your executives will thank you because they want the big picture in like 30 seconds, not some massive data dump in a meeting. Honestly, the right chart can create those lightbulb moments that actually get decisions made. I'd start with basic bar charts or line graphs first. Save the fancy dashboard stuff until you've got those down - don't overcomplicate it right away.
Dude, templates are a lifesaver. I used to waste entire afternoons just trying to figure out the basic layout - so frustrating. Now I just grab a solid template and drop in my company's numbers, market stuff, and competitor info. Takes like 30-45 minutes instead of half a day. The best part? You won't accidentally skip important sections since they're already built in. I mean, who remembers to include everything when you're starting blank? Just find a basic one and tweak it for whatever industry you're in. Trust me on this one.
Don't try to cram your entire company story into one pitch - biggest rookie mistake ever. Your audience will check out fast if you're rattling off every feature and milestone since day one. Focus on what actually matters to them instead. Skip the corporate buzzword soup too (seriously, nobody cares about "synergistic solutions"). Lead with real value and throw in actual numbers when you can. Those cheesy stock photos of handshakes? Yeah, ditch those. Oh, and always end with a clear ask - what exactly do you want them to do next?
Think of your business overview like telling a story - problem first, then how you fixed it. Skip the boring feature lists that make people's eyes glaze over. Start with why you even began this thing in the way. What specific mess were customers dealing with? Then walk through your solution journey. Honestly, I see so many companies just vomit technical specs everywhere. Don't do that. Use real examples instead of vague descriptions. Make it feel like you're explaining an adventure to someone at coffee, not reading from a manual. Your company's the guide helping people through their challenges - that's way more interesting than whatever corporate speak you had before.
Start with the obvious ones - revenue trends, profit margins, customer acquisition costs, and cash flow. Those are must-haves. Market share and retention rates show how you stack up against competitors too. Growth metrics always make stakeholders happy, even small wins. Oh, and make sure your KPIs actually tell a story about where you've been and where you're going. Don't dump a million vanity metrics on them though - that's just annoying. Pick maybe 6-8 that actually matter and explain what they mean for the company's future.
Just swap out the sections that actually matter for your industry. Tech startups? Focus on user growth and how fast you're burning cash. Manufacturing? Talk production capacity and supply chains instead. Keep the basic bones - mission, market position, financials - but change the language and metrics to what your investors actually give a damn about. It's basically business plan mad libs, honestly. Grab a decent template and replace all the boring generic stuff with whatever problems and wins your sector cares about. Way easier than starting from scratch.
Dude, presentations are totally changing right now. AI templates that automatically adjust your content are everywhere. Interactive stuff lets people actually click and engage instead of just staring. Real-time data viz is pretty cool too - charts that update live during your presentation. Oh, and mobile design isn't optional anymore since literally everyone reviews slides on their phone first. That basic PowerPoint template look? Yeah, it's dead. Tools now have way better visual storytelling and you can actually customize for your brand. If you're making decks regularly, definitely try the dynamic content features. Just make sure everything looks decent on mobile too.
Look, first thing - grab your brand values and compare them side by side with your overview. Does it actually sound like YOU? I swear, half the company overviews I read are so corporate and boring, like someone just copy-pasted from a template. Check if you're using the same words and tone from your other marketing stuff. If your Instagram is casual and fun, don't write an overview that sounds like a law firm, you know? Go through it line by line. Same terminology? Same personality? The whole point is making everything feel connected so customers aren't getting whiplash.
Honestly, anonymous surveys right after your presentation work best - people actually tell you the truth when their name isn't attached. I'd also grab coffee with key folks within the week for deeper convos. During the actual presentation, watch faces. If someone looks lost, just pause and check in. Way better than plowing ahead while half the room is confused. Ask specific stuff like "what would you cut from this?" instead of that generic "any feedback?" question. Nobody ever answers that one honestly anyway. The trick is making people feel safe to be real with you, then actually doing something with what they say.
Honestly? Every quarter minimum, but really depends on your industry. Fast-moving stuff needs monthly updates - learned that the hard way. Nothing worse than presenting last quarter's revenue numbers to investors (awkward silence, anyone?). Major product launches are obvious triggers for updates. Same with big partnerships or when your target market shifts. Revenue changes too, obviously. Set a calendar reminder to at least review it monthly, even if you don't change anything. Keeps you from looking like an idiot with outdated info.
Honestly, start with whatever your team already knows - PowerPoint's got some decent interactive stuff now. Canva and Prezi are solid too if you want something that looks less corporate. Got lots of data? Tableau and Power BI will make your spreadsheets actually interesting for once. Figma's great for web stuff - you can make clickable prototypes that feel pretty legit. Oh, and platforms like Notion or Airtable let you embed interactive bits right into your overview, which is kinda neat. My advice? Just add one interactive thing at a time so you don't overwhelm people.
-
Excellent products for quick understanding.
-
Informative presentations that are easily editable.