


Manufacturing Business Analysis Powerpoint Presentation Slides




Try Before you Buy Download Free Sample Product
 Impress Your
 Audience
 100%
100% Editable
 Save Hours
 of Time


Introducing our Manufacturing Business Analysis PowerPoint Presentation Slides to make your task easy and time-efficient. Present a detailed account of your business operations and the challenges faced in manufacturing through our business analytics PPT slides. This quantitative analysis PPT deck lets you cover the key elements, milestones, balance-sheet, and market share of the company to educate your audience about the overall business overview of the company. Engage in performance analysis of the company by highlighting revenue split and sales performance by utilizing our manufacturing-assessment PPT deck. Track the sales, revenue, and engage in quality-control by taking the aid of our production analysis PPT templates. Enlighten your audience about your company’s global presence, vision, mission, goals, and provide an apt comparison of the competitors’ business analysis by employing our marketing analysis PPT presentation. Introduce your team and the key figures responsible for formulating the business strategy utilizing this business assessment PPT slideshow.
People who downloaded this PowerPoint presentation also viewed the following :
Content of this Powerpoint Presentation
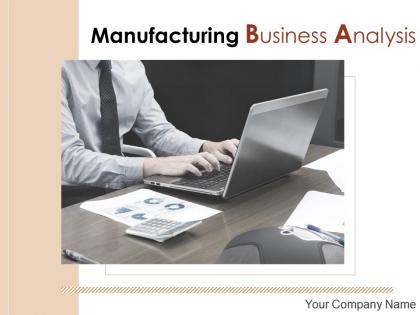
Slide 1: This title slide introduces Manufacturing Business Analysis. Add the name of your company here.
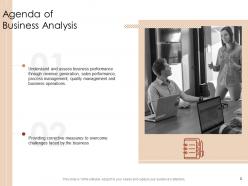
Slide 2: This slide presents the Agenda of Business Analysis. It includes - Understand and assess business performance through revenue generation, sales performance, process management, quality management, and business operations, and Providing corrective measures to overcome challenges faced by the business.
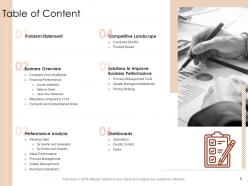
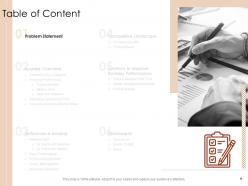
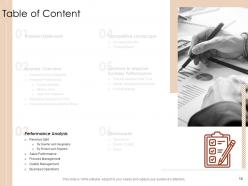
Slide 3: This slide contains the Table of Content. It includes - Problem Statement, Business Overview, Performance Analysis, Solutions to Improve Business Performance, Dashboards, and Competitive Landscape.
Slide 4: This is a table of content slide showing the Problem Statement.
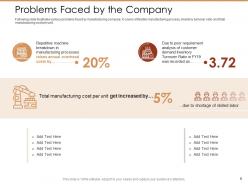
Slide 5: This slide presents the Problems Faced by the Company. The following slide illustrates various problems faced by manufacturing companies. It covers inflexible manufacturing processes, inventory turnover ratio, and total manufacturing costs per unit.
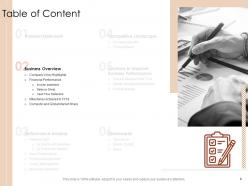
Slide 6: This is a table of content slide showing the Business Overview. It includes - Company’s Key Highlights, Financial Performance, Milestones Achieved in FY19, and Domestic and Global Market Share.
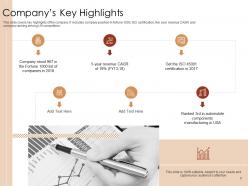
Slide 7: This slide presents the Company’s Key Highlights. It covers key highlights of the company. It includes company position in fortune 1000, ISO certification, five-year revenue CAGR, and company ranking among US competitors.
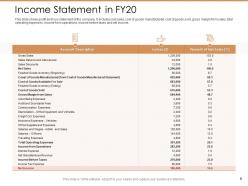
Slide 8: This slide presents the Income Statement in FY20. It shows the profit and loss statement of the company. It includes net sales, cost of goods manufactured, cost of goods sold, gross margin from sales, total operating expenses, income from operations, income before taxes, and net income.
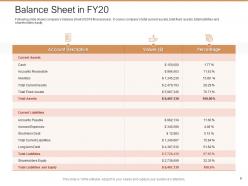
Slide 9: This slide presents the Balance Sheet in FY20. It shows the company’s balance sheet for the 2019 financial year. It covers the company’s total current assets, total fixed assets, total liabilities, and shareholder’s equity.
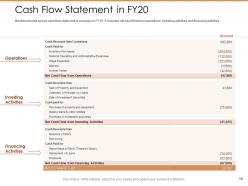
Slide 10: This slide presents the Cash Flow Statement in FY20. It shows the cash flow statement of the company in FY19. It includes net cash flow from operations, investing activities, and financing activities.
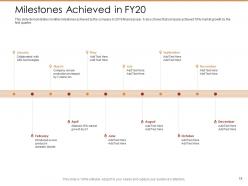
Slide 11: This slide presents the Milestones Achieved in FY20. It demonstrates monthly milestones achieved by the company in the 2019 financial year.
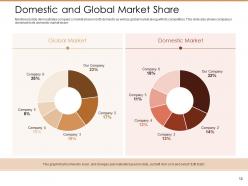
Slide 12: This slide presents the Domestic and Global Market Share. It demonstrates the company’s market share in both domestic as well as global market along with its competitors.
Slide 13: This is a table of content slide showing the Performance Analysis. It includes - Revenue Split, Sales Performance, Process Management, Quality Management, and Business Operations.
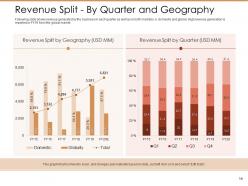
Slide 14: This slide presents the Revenue Split - By Quarter and Geography. It shows the revenue generated by the business in each quarter as well as in both markets i.e., domestic and global.
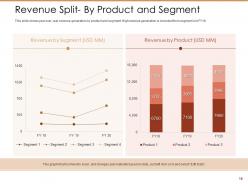
Slide 15: This slide presents the Revenue Split- By Product and Segment. It shows the year-over-year revenue generation by product and segment.
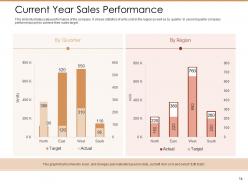
Slide 16: This slide presents the Current Year Sales Performance. It illustrates the sales performance of the company.
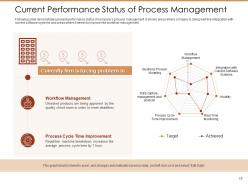
Slide 17: This slide presents the Current Performance Status of Process Management. It demonstrates the present performance status of the company’s process management.
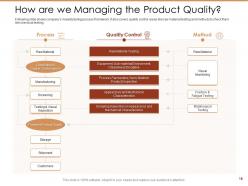
Slide 18: This slide presents How are we Managing Product Quality? It shows the company’s manufacturing process framework.
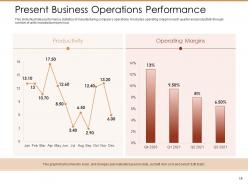
Slide 19: This slide presents the Present Business Operations Performance. It illustrates performance statistics of manufacturing company’s operations.
Slide 20: This is a table of content slide showing the Competitive Landscape. It includes - Company Specific and Product Based.
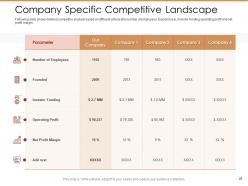
Slide 21: This slide presents the Company Specific Competitive Landscape. It shows detailed competitor analysis based on different criteria like the number of employees, founded year, investor funding operating profit, and net profit margin.
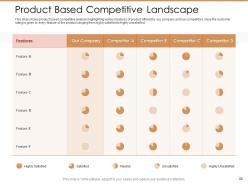
Slide 22: This slide presents the Product-Based Competitive Landscape. It shows product-based competitive analysis highlighting various features of products offered by our company and our competitors.
Slide 23: This is a table of content slide showing Solutions to Improve Business Performance. It includes - Process Management Tools, Quality Management Methods, and Pricing Strategy.
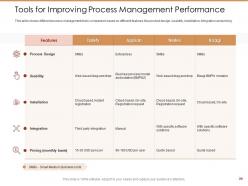
Slide 24: This slide presents the Tools for Improving Process Management Performance. It shows different process management tools comparison based on different features like product design, usability, installation, integration, and pricing.
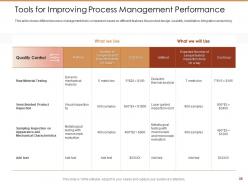
Slide 25: This slide presents the Tools for Improving Process Management Performance. It shows different process management tools comparison based on different features like product design, usability, installation, integration, and pricing.
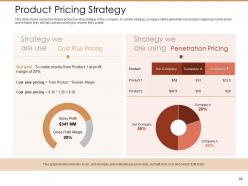
Slide 26: This slide presents the Product Pricing Strategy. It shows the current and future product pricing strategy of the company.
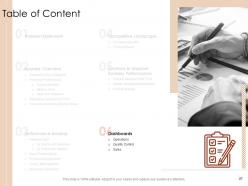
Slide 27: This is a table of content slide showing Dashboards. It includes – Operations, and Quality Control, and Sales.
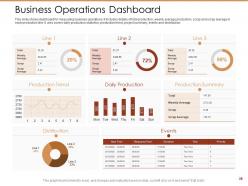
Slide 28: This slide presents the Business Operations Dashboard. It shows a dashboard for measuring business operations. It includes details of total production, weekly average production, scrap and scrap average in each production line.
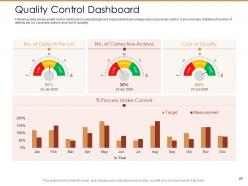
Slide 29: This slide presents the Quality Control Dashboard. It shows a quality control dashboard covering the target and measurement percentage of the process under control.
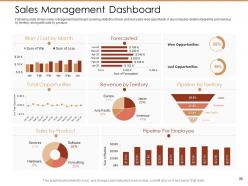
Slide 30: This slide presents the Sales Management Dashboard. It shows a sales management dashboard covering statistics of won and lost sales lead opportunities.
Slide 31: This is the Icons Slide for Manufacturing Business Analysis.
Slide 32: This slide introduces Graphs & Charts.
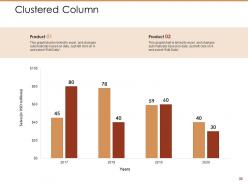
Slide 33: This slide shows a Clustered Column that compares 2 products’ sales over a timeline of years.
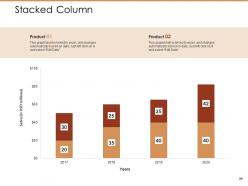
Slide 34: This slide shows a Stacked Column that compares 2 products’ sales over a timeline of years.
Slide 35: This slide introduces the Additional Slides.
Slide 36: This slide provides the Mission for the entire company. This includes the vision, the mission, and the goal.
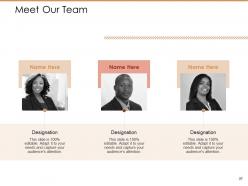
Slide 37: This slide shows the members of the company team with their name, designation, and photo.
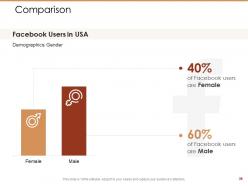
Slide 38: This slide Comparison shows the comparison between the percentage of male and female Facebook users.
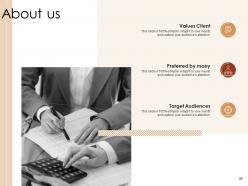
Slide 39: This slide contains the information about the company aka the ‘About Us’ section. This includes the Value Clients, the Target Audience, and Preferred by Many.
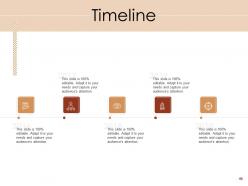
Slide 40: This slide is a Timeline template to showcase the progress of the steps of a project with time.
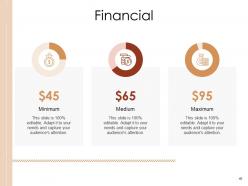
Slide 41: This slide presents the Financial with a data’s numbers at minimum, medium, and maximum percentage.
Slide 42: This is the Quotes slide. Add your favorite quote here.
Slide 43: This is a Thank You slide where details such as the address, contact number, email address are added.
Manufacturing Business Analysis Powerpoint Presentation Slides with all 43 slides:
Use our Manufacturing Business Analysis Powerpoint Presentation Slides to effectively help you save your valuable time. They are readymade to fit into any presentation structure.


FAQs for Manufacturing Business Analysis
Start with OEE and defect rates - those two will tell you everything about what's actually happening on your floor. Inventory turnover and cycle times are huge too. Honestly, capacity utilization is probably more important than most people realize, especially if you're trying to scale. I'd throw in first-pass yield and cost per unit because margins matter. Oh, and don't sleep on customer complaints - they're a leading indicator before things get ugly. Pick maybe 3-4 that hit your biggest problems first. You can always add more once you've got those sorted.
Honestly, lean manufacturing is a game-changer for cutting waste and boosting efficiency. Your cycle times get faster, inventory costs drop, and you're not burning through materials like crazy. Once teams start looking for inefficiencies, they find them everywhere – it's kind of wild how much waste you don't notice at first. Workers aren't standing around doing busy work anymore, so labor costs go down. Plus you need way less floor space for the same output, which is huge. I'd start with value stream mapping to find your worst problem areas. That's where you'll see results fast and can build momentum from there.
Dude, manufacturing tech has gotten crazy good lately. IoT sensors track everything - machine performance, energy usage, you name it. AI handles production scheduling while robots do the boring repetitive stuff. The coolest part? Robots can actually work next to people now without being death traps. Predictive maintenance is a game changer too since it catches problems before your equipment dies on you. My advice though - don't go nuts and upgrade everything at once. Pick one process first, see how it goes, then expand from there. Way less stressful that way.
Honestly, data analytics is a game changer for supply chain stuff. It'll help you catch bottlenecks before they screw you over and actually predict when you'll need more inventory. Plus you can finally figure out which suppliers are constantly late (Dave's recommendations were trash, weren't they?). The cool part is mixing old data with real-time tracking - suddenly you're not scrambling to reorder things last minute. Start small though, just basic inventory analytics first. You'll save money pretty much immediately and customers won't be waiting around forever for their orders. Way less headaches overall.
Dude, it's rough out there for small manufacturers. You're stuck with tight cash flow while big companies throw money around like confetti. Your team is probably stretched thin, and suppliers don't give you the same deals they offer to Fortune 500 companies. Per-unit costs stay high because you can't buy in massive volumes. The whole thing feels unfair honestly. But here's what I've noticed - you can pivot way faster than those slow corporate machines. When they're still in committee meetings, you've already changed direction. Find your sweet spot where being small and personal actually wins over mass production efficiency.
Dude, sustainability is literally changing how every manufacturer operates - supply chains, product design, financial reporting, all of it. Consumers are demanding it, regulations keep getting stricter, and companies are realizing it actually saves them money through better efficiency. Honestly, I think some executives were shocked by that last part. It's not optional anymore - ignore sustainability and you'll lose customers, face penalties, and miss out on cost savings. Your competitors who embrace it? They're gonna have a real advantage. I'd start with an environmental audit to find easy wins that'll cut costs while hitting your sustainability goals.
Dude, cross-train everyone you can and get flexible with scheduling based on what production actually needs. Build those skills matrices so you know exactly who can jump into different roles when someone calls out sick. Plants that crush this treat workforce planning like they're managing inventory - always tracking what skills they've got vs what they need. Real-time communication tools help tons, plus regular skills check-ins and clear paths for people to advance. Oh, and rotation schedules keep workers from getting bored while covering your critical stuff. Honestly? Start by figuring out your current skill gaps first, then build from there.
Honestly, build quality checks into every step instead of just testing at the end. Train your people to catch problems early - and actually let them stop production when something's off. Real-time tracking of your key metrics is huge here. Too many places try to fix everything after it's already messed up, which just burns money. Prevention beats inspection every time. Standardize your processes, keep equipment maintained, document everything properly. Oh and set up some kind of dashboard everyone can actually read - don't make it complicated. Way better than scrambling to fix defects later.
Hey! Post-Industry 4.0 is all about smart everything and going green. IoT sensors everywhere, AI predicting when stuff breaks, real-time analytics catching problems early. Digital twins are blowing up too - they're like virtual copies of your actual operations. Sustainability pressure is crazy intense right now, honestly feels like every company's scrambling to hit carbon-neutral goals. Circular manufacturing is the new thing. But here's what you should actually do: figure out where you can stick sensors in your current setup and start collecting data. That baseline info will save your ass later when you're ready to level up.
Honestly, just pick your most annoying repetitive stuff first - assembly lines, quality checks, inventory tracking. Don't make the same mistake I've watched other companies make by automating random processes that barely matter. Focus on whatever's eating up the most labor hours and isn't too complicated. Robots don't need coffee breaks, so they'll run all night. Plus automated quality control spots defects way faster than people do. Smart inventory systems stop you from running out of stock too. My take? Start small with one process, see how it goes, then build from there. No point going crazy right out the gate.
Dude, you've got to stay on top of risk management in manufacturing - there's just too much that can blow up on you. Equipment breaks down, suppliers flake out, someone gets hurt, or quality goes to hell. Any of these will either shut you down or cost a fortune. Honestly, the regulatory stuff alone will give you headaches if you're not careful. Map out your biggest vulnerabilities first, then figure out what'd hurt most if it went sideways. I'd focus on your top 3-5 risks and build some decent backup plans around those.
Honestly, get your regulatory folks involved from the very beginning - like, day one of brainstorming. Don't wait until you've built something cool only to find out it's completely illegal (been there, seen that disaster). Have your R&D and compliance teams actually talk to each other regularly instead of working in silos. Another trick? Test your innovation in markets with looser regulations first, then expand. I know it sounds backwards, but you'll move way faster overall. The companies that nail this treat compliance as part of the creative process, not some annoying hurdle at the end.
Look, customer feedback is basically your reality check - it shows you what users actually want instead of what you're guessing they want. Set up different ways to collect it: surveys, user interviews, support tickets, social media stuff. Pain points and feature requests will pop up that your team totally missed. Here's the thing though - some companies go crazy collecting feedback then do nothing with it, which is honestly pretty annoying for customers. Group similar feedback together, then focus on what comes up most and what'll actually move the needle business-wise. That's how you figure out what to build next.
Start with gross margin - tells you if your pricing isn't terrible and costs are under control. Inventory turnover is huge too because money sitting in unsold stuff is just... sitting there. Working capital ratio shows whether you can actually pay your bills without panicking. Capacity utilization matters since empty machines still cost money to own. Quality metrics like defect rates are critical - nothing kills profit faster than having to redo work. Honestly, just pick these five and check them weekly. Monthly reviews are too slow when things go sideways.
Honestly, partnerships are like a cheat code for growing faster. You get access to new markets and tech without dropping crazy money upfront. Joint ventures with overseas manufacturers? Game changer for going global. Or team up with tech companies for IoT stuff - way better than spending years figuring it out yourself. Even weird partnerships work, like collaborating with competitors on R&D (I know, sounds backwards but it's genius). Supplier partnerships can slash your costs too. Just map out what you're missing right now, then find who's already crushing those areas. Their strengths should fill your gaps perfectly.
-
Great designs, Easily Editable.
-
Designs have enough space to add content.
-
Easy to edit slides with easy to understand instructions.
-
Great product with effective design. Helped a lot in our corporate presentations. Easy to edit and stunning visuals.
-
Designs have enough space to add content.
-
Graphics are very appealing to eyes.
-
Enough space for editing and adding your own content.
-
Awesomely designed templates, Easy to understand.
-
Very unique, user-friendly presentation interface.
-
Content of slide is easy to understand and edit.