


Business Market Analysis Powerpoint Presentation Slides





Try Before you Buy Download Free Sample Product
 Impress Your
 Audience
 100%
100% Editable
 Save Hours
 of Time


Engage in a thorough assessment of your business plan and strategies by taking the aid of our Business Market Analysis PowerPoint Presentation Slides. Survey the worldwide spending statistics and industry trends for your company to formulate an infallible business plan with the assistance of this marketing research PPT presentation. Highlight the market landscape that influences the commercial operations of your firm by employing these commercial evaluation PPT templates. Engage in analysis of every crucial element and prepare a report on your shortcomings and strengths in comparison to your competitors with the help of our market assessment PowerPoint presentation. Generate a customer journey map to get the customer insights on your brand services by utilizing our business research PPT slideshow that allows you to take advantage of the thousands of available and adaptable tables, images, icons, shapes, and charts. Download this professionally created consumer survey PPT deck that provides you with the opportunity to save your time and efforts and impress your viewers with this readymade and completely customizable presentation.
People who downloaded this PowerPoint presentation also viewed the following :
Content of this Powerpoint Presentation
Slide 1: This title slide introduces the Business Market Analysis. Add the name of your company here.
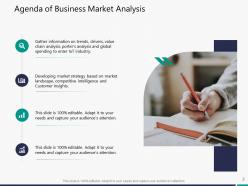
Slide 2: This is the Agenda slide of Business Market Analysis.
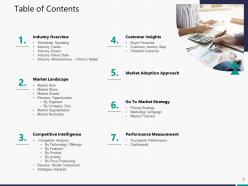
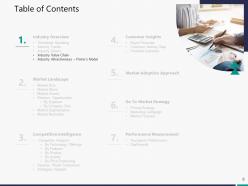
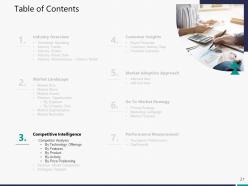
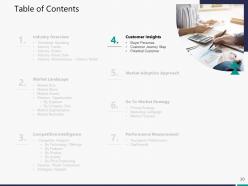
Slide 3: This slide contains the Table of Contents. It includes - Industry Overview, Market Landscape, Competitive Intelligence, etc.
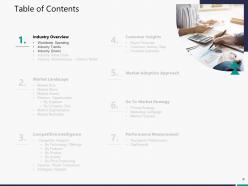
Slide 4: This is a table of content slide showing the Industry Overview.
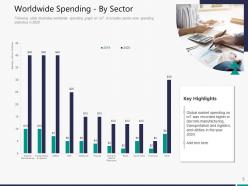
Slide 5: This slide presents the Worldwide Spending - By Sector.
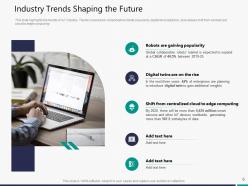
Slide 6: This slide presents the Industry Trends Shaping the Future.
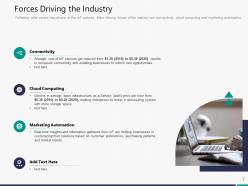
Slide 7: This slide presents the Forces Driving the Industry.
Slide 8: This is a table of content slide showing the Market Landscape.
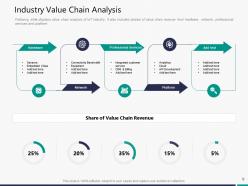
Slide 9: This slide presents the Industry Value Chain Analysis
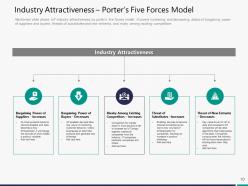
Slide 10: This slide presents the Industry Attractiveness – Porter’s Five Forces Model.
Slide 11: This is a table of content slide showing the Competitive Intelligence.
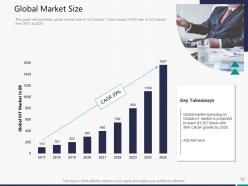
Slide 12: This slide presents the Global Market Size.
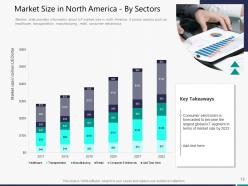
Slide 13: This slide presents the Market Size in North America - By Sectors.
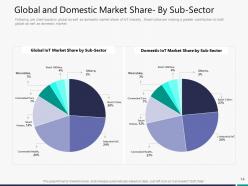
Slide 14: This slide presents the Global and Domestic Market Share- By Sub-Sector.
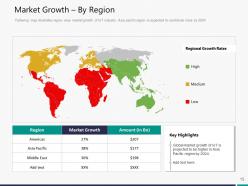
Slide 15: This slide presents the Market Growth – By Region.
Slide 16: This is a table of content slide showing the Customer Insights.
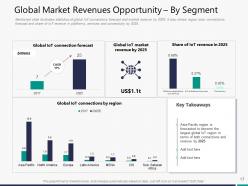
Slide 17: This slide presents the Global Market Revenues Opportunity – By Segment.
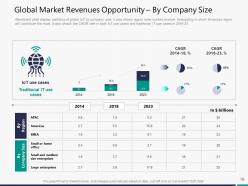
Slide 18: This slide presents the Global Market Revenues Opportunity – By Company Size.
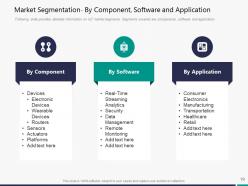
Slide 19: This slide presents the Market Segmentation- By Component, Software, and Application.
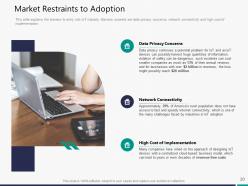
Slide 20: This slide presents the Market Restraints to Adoption.
Slide 21: This is a table of content slide showing the Market Adoption Approach.
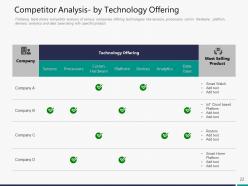
Slide 22: This slide presents the Competitor Analysis- by Technology Offering.
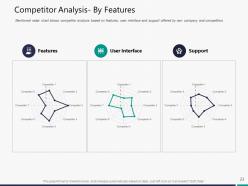
Slide 23: This slide presents the Competitor Analysis- By Features.
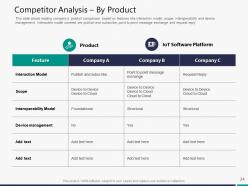
Slide 24: This slide presents the Competitor Analysis – By Product.
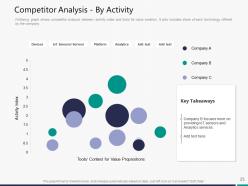
Slide 25: This slide presents the Competitor Analysis - By Activity.
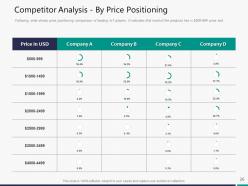
Slide 26: This slide presents the Competitor Analysis - By Price Positioning.
Slide 27: This is a table of content slide showing the Go To Market Strategy.
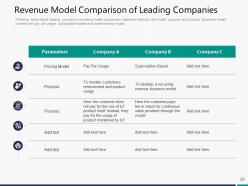
Slide 28: This slide presents the Revenue Model Comparison of Leading Companies.
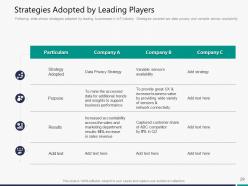
Slide 29: This slide presents the Strategies Adopted by Leading Players.
Slide 30: This is a table of content slide showing the Performance Measurement.
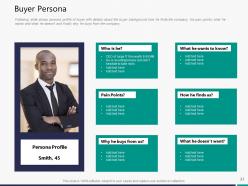
Slide 31: This slide presents the Buyer Persona.
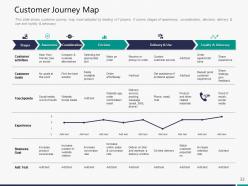
Slide 32: This slide presents the Customer Journey Map.
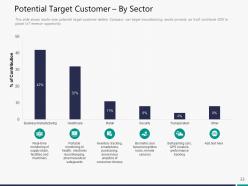
Slide 33: This slide presents the Potential Target Customer – By Sector.
Slide 34: This is a table of content slide showing the Market Adoption Approach.
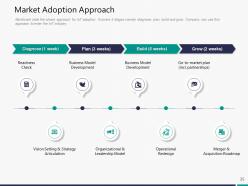
Slide 35: This slide presents the Market Adoption Approach.
Slide 36: This is a table of content slide showing the Go To Market Strategy.
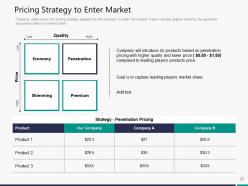
Slide 37: This slide presents the Pricing Strategy to Enter Market.
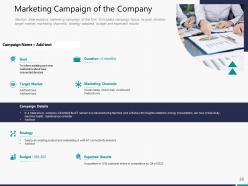
Slide 38: This slide presents the Marketing Campaign of the Company.
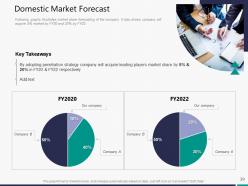
Slide 39: This slide presents the Domestic Market Forecast.
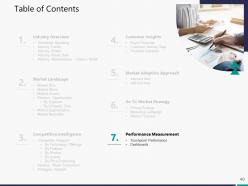
Slide 40: This is a table of content slide showing the Performance Measurement.
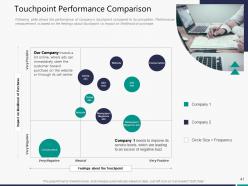
Slide 41: This slide presents the Touchpoint Performance Comparison.
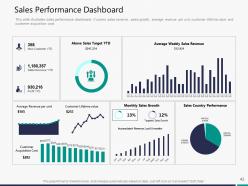
Slide 42: This slide presents the Sales Performance Dashboard.
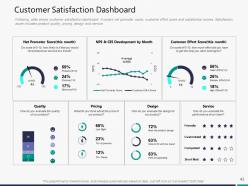
Slide 43: This slide presents the Customer Satisfaction Dashboard.
Slide 44: This is the Business Market Analysis Icons Slide.
Slide 45: This slide introduces the Additional Slides.
Slide 46: This slide provides the Mission for the entire company. This includes the vision, the mission, and the goal.
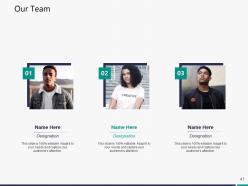
Slide 47: This slide shows the members of the company team with their name, designation, and photo.
Slide 48: This slide contains the information about the company aka the ‘About Us’ section. This includes the Value Clients, the Target Audience, and Preferred by Many.
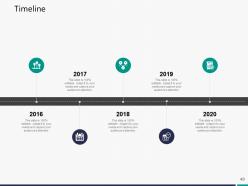
Slide 49: This slide is a Timeline template to showcase the progress of the steps of a project with time.
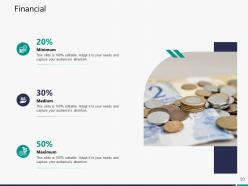
Slide 50: This slide presents the Financial data with the data’s numbers at minimum, medium, and maximum percentage.
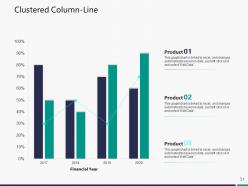
Slide 51: This slide shows a Clustered Column-Line that compares 3 products’ data over a timeline of financial years.
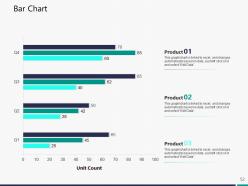
Slide 52: This slide shows a Bar Chart that compares 3 products’ unit count over a timeline of financial quarters.
Slide 53: This slide presents Our Goal.
Slide 54: This is a slide with a 30 60 90 Days Plan to set goals for these important intervals.
Slide 55: This is a Thank You slide where details such as the address, contact number, email address are added.
Business Market Analysis Powerpoint Presentation Slides with all 55 slides:
Use our Business Market Analysis Powerpoint Presentation Slides to effectively help you save your valuable time. They are readymade to fit into any presentation structure.



FAQs for Business Market Analysis
So the main ones you wanna look at are age, income, education, and where people live. Gender can matter too depending on what you're selling. Household size is actually pretty underrated - like families with kids buy totally different stuff than single people. Same with job status. Oh and urban vs suburban makes a huge difference in spending habits. Honestly though, don't just collect random data points. Start by looking at your current customers first and see what patterns actually show up. That'll tell you which demographics really matter for your business instead of just guessing.
Hey, so think of economic indicators as your crystal ball for market changes. GDP growth and falling unemployment? People start spending like crazy. But inflation hits and suddenly everyone's clutching their wallets - it's honestly wild how fast the mood shifts. Consumer confidence surveys are gold because they show you what people actually think is coming next, not just what's happening now. I'd pick maybe 3 indicators that really matter for your space. Timing launches around this stuff can make or break you.
Look, competition research is huge for your market analysis - it shows you what's actually possible out there. Map out your direct and indirect competitors first. Then dive into their pricing, market share, how they position themselves. I've watched so many startups completely bomb because they skipped this part and their numbers were totally unrealistic. This research helps you find gaps in the market and price things right. Also spots threats early or even partnership chances. Start with your top 5-10 competitors and really dig into what they're doing. Trust me on this one.
SWOT's pretty solid for checking if your market idea actually makes sense. First, be brutal about whether your strengths line up with what people actually want - not what you think they want. Then dig into those "opportunities" because honestly, half the time they're just wishful thinking. Your weaknesses matter way more if competitors are crushing it in those areas. External threats are the scary ones though - new regulations or economic stuff can wreck everything overnight. I'd map it all out, then look for the intersections where things either click perfectly or completely fall apart. Those spots will tell you if it's worth pursuing.
Honestly, surveys are probably your best starting point - online ones won't break the bank and you'll get data fast. Focus groups give you way deeper insights but they're expensive as hell. One-on-one interviews are amazing for really understanding why people do what they do. If you're in retail or services, just watching customers can tell you tons. Oh, and phone interviews usually get better responses than online stuff, though they take more time. I'd probably start with a basic survey first, see what patterns come up, then do some interviews to dig into the interesting bits.
So emerging markets are absolutely booming right now. Mobile adoption is insane across Africa and Southeast Asia - everyone's suddenly got smartphones and using fintech apps. The middle class is growing fast too, so there's way more spending power. ESG money is flowing into sustainable projects, though honestly the regulations are all over the place. Oh and commodity prices are helping, plus companies are diversifying away from China which opens doors. I'd probably look at places with decent digital infrastructure first - and make sure they're politically stable because that stuff matters way more than people think.
Dude, you absolutely need customer segmentation. Like, I can't stress this enough - without it you're basically shooting in the dark. Averages are useless because they don't actually represent real people buying your stuff. Once you break things down properly, you'll spot which groups are growing or dying off. Different segments have totally different price points they'll tolerate, buying cycles, pain points - the whole nine yards. Oh and start with wherever you're making the most money first. That's probably obvious but yeah. Each group needs its own lens basically, like you're looking at completely different markets.
Honestly, I'd go with whatever plays nice with your current data setup first. Tableau and Power BI are the big names - bit of a learning curve but they're workhorses once you figure them out. Google Data Studio is actually pretty decent and won't cost you anything (especially if you're already using their analytics stuff). Excel might sound basic but I've seen some crazy impressive dashboards built with just pivot charts and conditional formatting. Really depends on how complex your data is. Maybe grab Tableau's free trial and see if the bells and whistles are worth the price tag?
Honestly, social media analytics are a game changer for understanding what's actually happening with your customers right now. Track brand mentions and see what content really hits - way better than those survey responses people give just to be polite. I love how you can spot competitors making moves and catch potential drama before it explodes everywhere. The data's super fresh too. Set up dashboards to monitor your industry keywords and main competitors. Oh, and you'll find influencers in your space plus predict demand shifts from social conversations. It beats traditional research by miles.
Honestly, just be super upfront about what you're collecting and why. Don't hide stuff in fine print - people hate that. Make sure they can actually understand what they're signing up for. I'd definitely anonymize everything personal right away, and let people bail out whenever they want. Oh, and if you're giving incentives, be clear about those too. Companies mess this up all the time and then wonder why they get in trouble later. Set your data retention rules early and actually follow them. Trust me, it's way easier than dealing with angry customers or legal headaches down the road.
Tech tools are completely changing how we analyze markets now. Real-time data, AI predictions, social media tracking - it's all so much faster than those old quarterly surveys we used to rely on. Honestly, the speed difference is crazy. But here's what I've learned: you still need solid analytical skills to make sense of all that data flooding in. Otherwise you're just drowning in numbers, you know? Don't try to revolutionize your whole process overnight though. Pick one new tool and work it into what you're already doing. Way less overwhelming that way.
Dude, watch your customer acquisition costs - if they're climbing while conversion rates tank, you're in trouble. Deal sizes shrinking is another bad sign. Sales cycles getting longer? That's market saturation talking. I always get worried when companies start discounting way more just to close anything. Oh, and competitor activity ramping up is pretty obvious but worth tracking. Market share growth slowing down hits different than revenue drops though - it's sneakier. Customer lifetime value declining is brutal too. Set up dashboards to catch this stuff monthly, seriously. Don't wait until it smacks your revenue.
So basically, dig into your old sales data to see what patterns pop up. Look at the last 2-3 years and check for monthly/quarterly trends. You'll spot things like seasonal dips, which products always sell well, how you reacted to competitors, etc. Honestly, it's way better than guessing! Use those patterns to predict demand and plan inventory. Focus on stuff that keeps happening, not random one-time events. Oh, and it helps with timing product launches too - like don't launch winter coats in July, you know? Pretty straightforward once you start looking at the numbers.
Honestly, the hardest part is figuring out your customers - like, what they actually want vs what you think they want. Local buying habits can be totally different from what you're used to. Competition gets weird too because sometimes your real rivals aren't the obvious ones. Oh, and don't get me started on regulations and pricing - that stuff will surprise you. You're basically nobody to these customers right now, which sucks but is reality. I'd say test small first. Maybe a pilot in one area? That way you can mess up without going broke lol.
Dude, regulatory changes will completely flip your competitive analysis on its head. New rules can mess with entry barriers, cost structures, or create whole new market segments literally overnight. Your quarterly projections? Toast if you're not watching this stuff closely. I learned this the hard way last year - totally missed a compliance shift that changed everything. You've got to bake regulatory monitoring right into your process. Track proposed laws, compliance trends, enforcement patterns. Don't just dump it on your legal team either. Treat regulatory intel like market intel, because honestly that's exactly what it is.
-
Great product with highly impressive and engaging designs.
-
Awesome use of colors and designs in product templates.
-
Design layout is very impressive.