


Competitive market analysis powerpoint presentation slides
Presenting our Competitive Market Analysis Powerpoint Presentation Slides for developing an offensive and defensive business plan. Utilize these open trade PPT templates to examine the forces in action influencing the industry, global common market, and market growth. Create a systematic and organized comparative analysis of businesses through our unconfined enterprises PPT graphics and assess your strengths and weaknesses based on the report. Shape your business strategies by understanding the customer insights with help of our trading port PPT presentation. This trade PowerPoint slideshow allows you to indulge in preparing a thorough market and pricing strategy. Performance evaluation plays a critical role in determining dominance in the market domain. Therefore, download these free-trade area PPT layouts to elucidate the goals and objectives of your company and create a roadmap to achieve them. Impress your audience by taking advantage of our completely customizable economic race PPT slides that present you with the opportunity to choose from thousands of available icons. Stay ahead of your business adversaries in this ever-changing marketplace with our professionally curated combative capitalism PPT deck.











































You must be logged in to download this presentation.


Do you want to remove this product from your favourites?
PowerPoint presentation slides
This complete deck comprises of Competitive Market Analysis Powerpoint Presentation Slides and has professionally designed templates with suitable visuals and appropriate content. This complete deck can be used to present to your team. It has PPT slides on various topics highlighting all the core areas of your business needs. This deck consists of total of fifty slides. All the slides are completely customizable for your convenience. You can change the colour, text and font size of these templates. You can add or delete the content if needed. Get access to this professionally designed complete presentation by clicking the download button below.

People who downloaded this PowerPoint presentation also viewed the following :
Content of this Powerpoint Presentation
Slide 1: This title slide introduces the Competitive Market Analysis. Add the name of your company here.
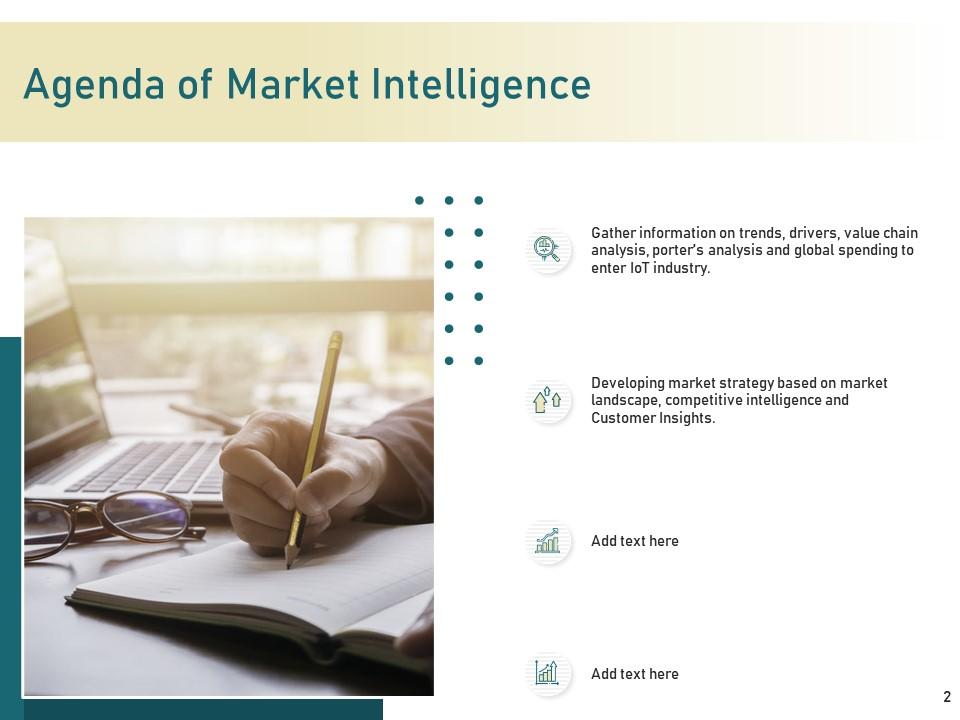
Slide 2: This is the Agenda slide of Market Intelligence. It includes - Developing a market strategy based on market landscape, competitive intelligence, and Customer Insights, Gather information on trends, drivers, value chain analysis, porter’s analysis, and global spending to enter the IoT industry, etc.
Slide 3: This slide contains the Table of Contents. It includes - Industry Overview, Market Landscape, Competitive Intelligence, etc.
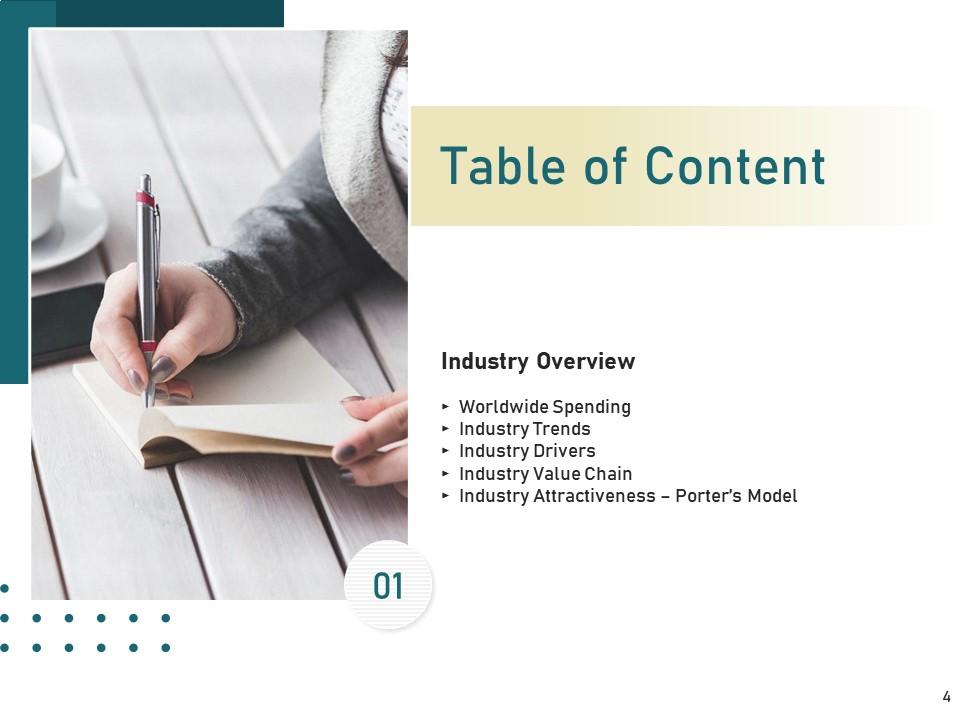
Slide 4: This is a table of content slide showing the Industry Overview. It includes - Worldwide Spending, Industry Trends, Industry Drivers, Industry Value Chain, and Industry Attractiveness – Porter’s Model.
Slide 5: This slide presents the Worldwide Spending - By Sector. It illustrates the worldwide spending graph on IoT.
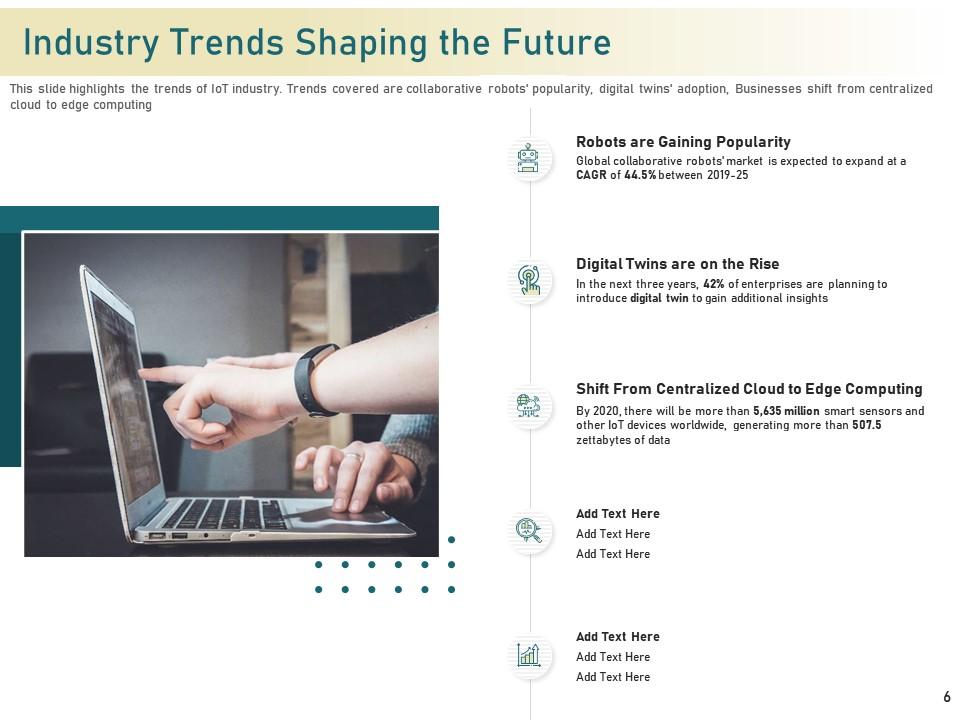
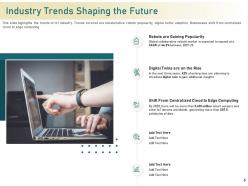
Slide 6: This slide presents the Industry Trends Shaping the Future. Trends covered are collaborative robots' popularity, digital twins' adoption, Businesses shift from centralized cloud to edge computing
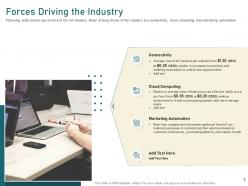
Slide 7: This slide presents the Forces Driving the Industry. It covers key drivers of the IoT industry. The major driving forces of the industry are connectivity, cloud computing, and marketing automation.
Slide 8: This slide presents the Industry Value Chain Analysis. It displays a value chain analysis of the IoT industry. It also includes shares of value chain revenue from hardware, network, professional services, and platform.
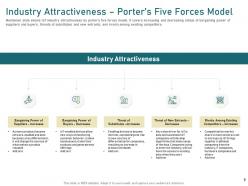
Slide 9: This slide presents the Industry Attractiveness – Porter’s Five Forces Model. It shows IoT industry attractiveness by porter’s five forces model. It covers the increasing and decreasing status of bargaining power of suppliers and buyers, threats of substitutes and new entrants, and rivalry among existing competitors.
Slide 10: This is a table of content slide showing the Market Landscape. It includes - Market Size, Market Share, Market Growth, Revenue Opportunities, Market Segmentation, and Market Restraints.
Slide 11: This slide presents the Global Market Size. This graph demonstrates the global market size of the IoT Industry.
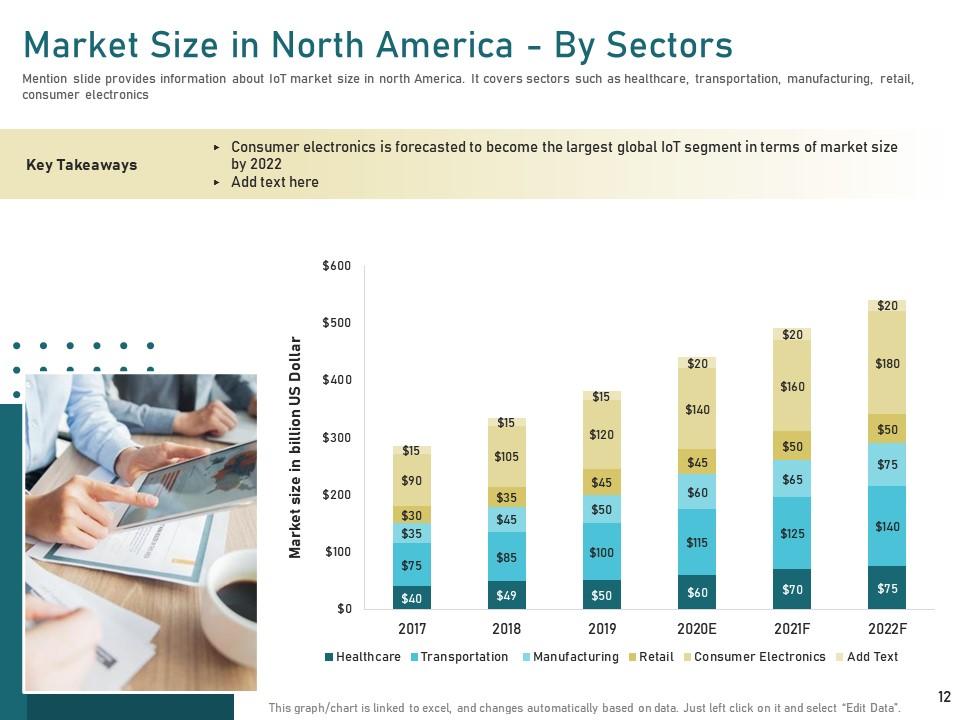
Slide 12: This slide presents the Market Size in North America - By Sectors. It covers sectors such as healthcare, transportation, manufacturing, retail, consumer electronics.
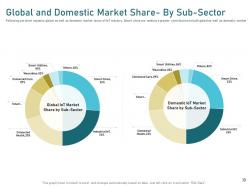
Slide 13: This slide presents the Global and Domestic Market Share- By Sub-Sector. Smart cities are making a greater contribution to both global as well as domestic markets.
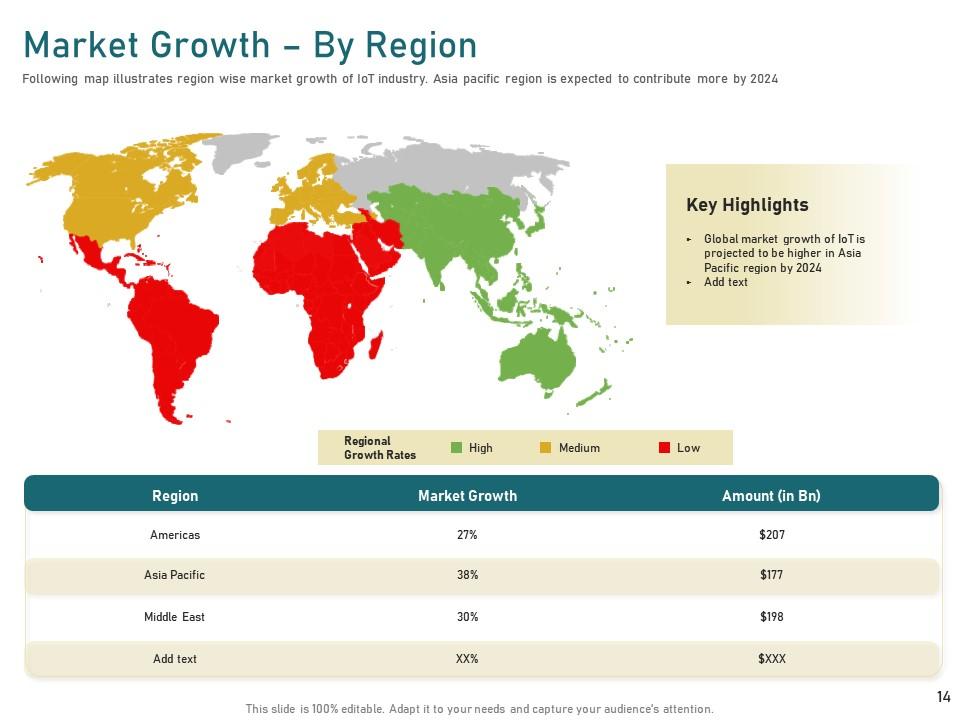
Slide 14: This slide presents the Market Growth – By Region. The following map illustrates the region-wise market growth of the IoT industry.
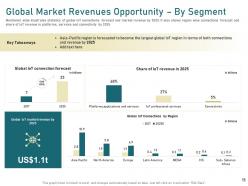
Slide 15: This slide presents the Global Market Revenues Opportunity – By Segment. It shows region-wise connections forecast and share of IoT revenue in platforms, services, and connectivity by 2025.
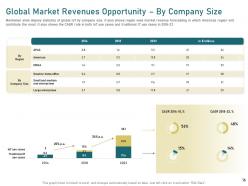
Slide 16: This slide presents the Global Market Revenues Opportunity – By Company Size. It shows region-wise market revenue forecasting in which America’s region will contribute the most.
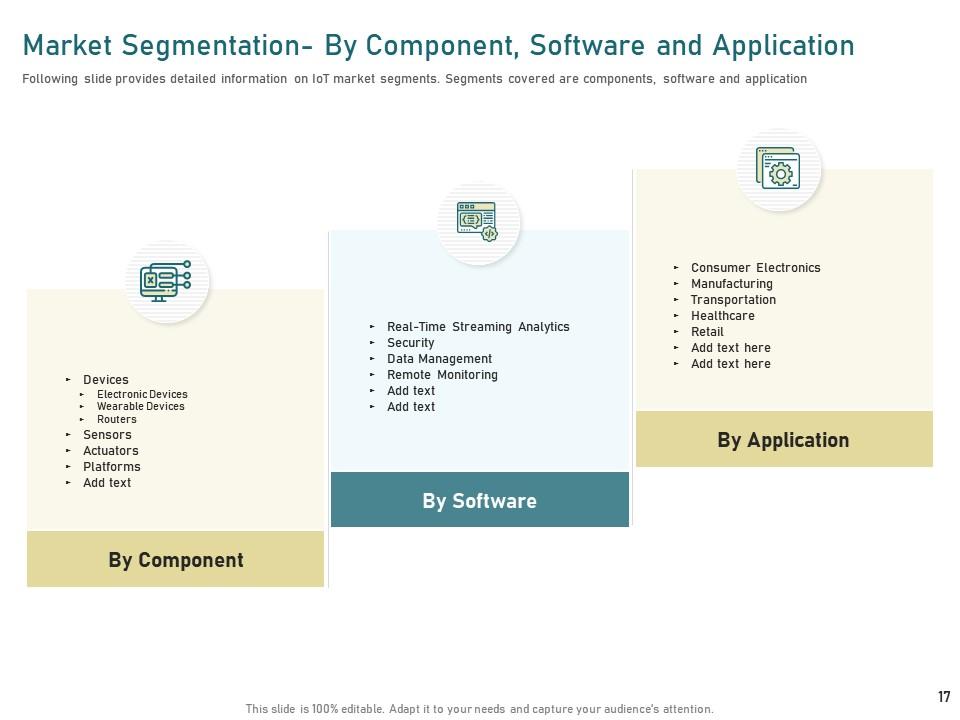
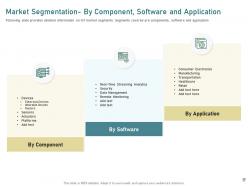
Slide 17: This slide presents the Market Segmentation- By Component, Software, and Application. It provides detailed information on IoT market segments. Segments covered are components, software, and application.
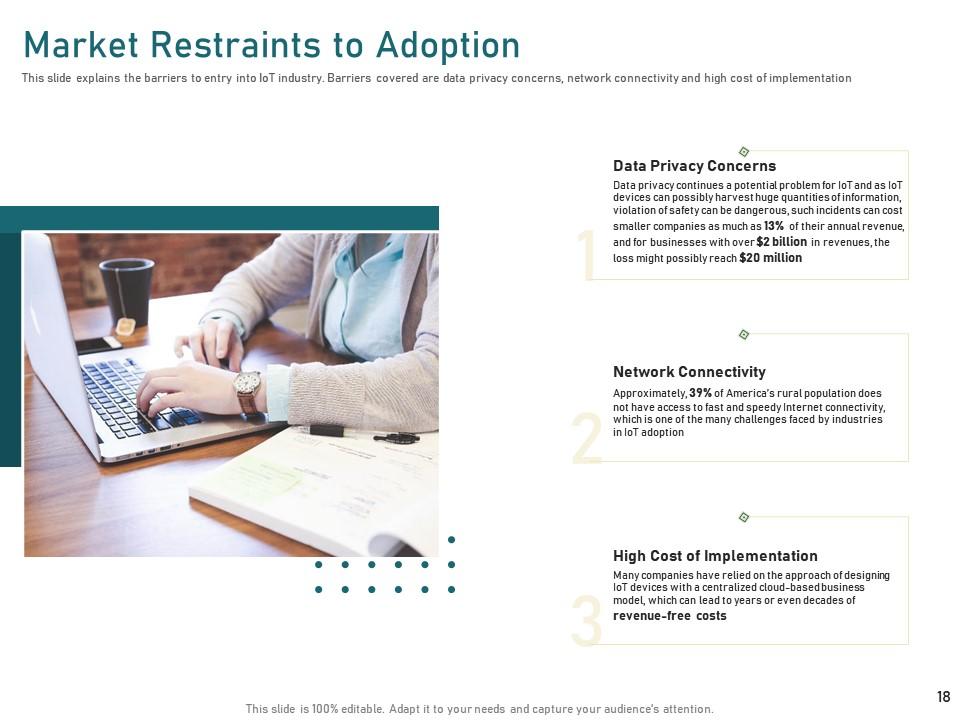
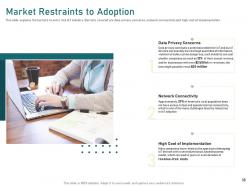
Slide 18: This slide presents the Market Restraints to Adoption. It explains the barriers to entry into the IoT industry. Barriers covered are data privacy concerns, network connectivity, and the high cost of implementation.
Slide 19: This is a table of content slide showing the Competitive Intelligence. It includes - Competitor Analysis, Revenue Model Comparison, and Strategies Adopted.
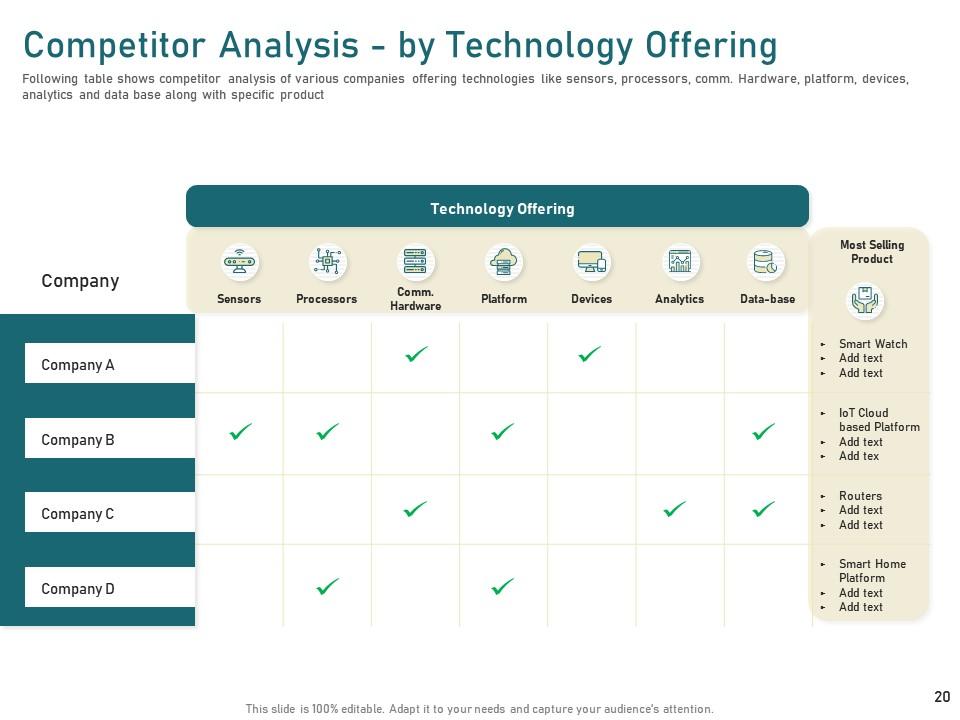
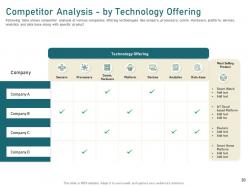
Slide 20: This slide presents the Competitor Analysis- by Technology Offering. It shows competitor analysis of various companies offering technologies like sensors, processors, comm. Hardware, platform, devices, analytics, and database along with the specific product.
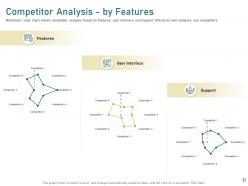
Slide 21: This slide presents the Competitor Analysis - by Features. Mentioned radar chart shows competitor analysis based on features, user interface, and support offered by own company and competitors.
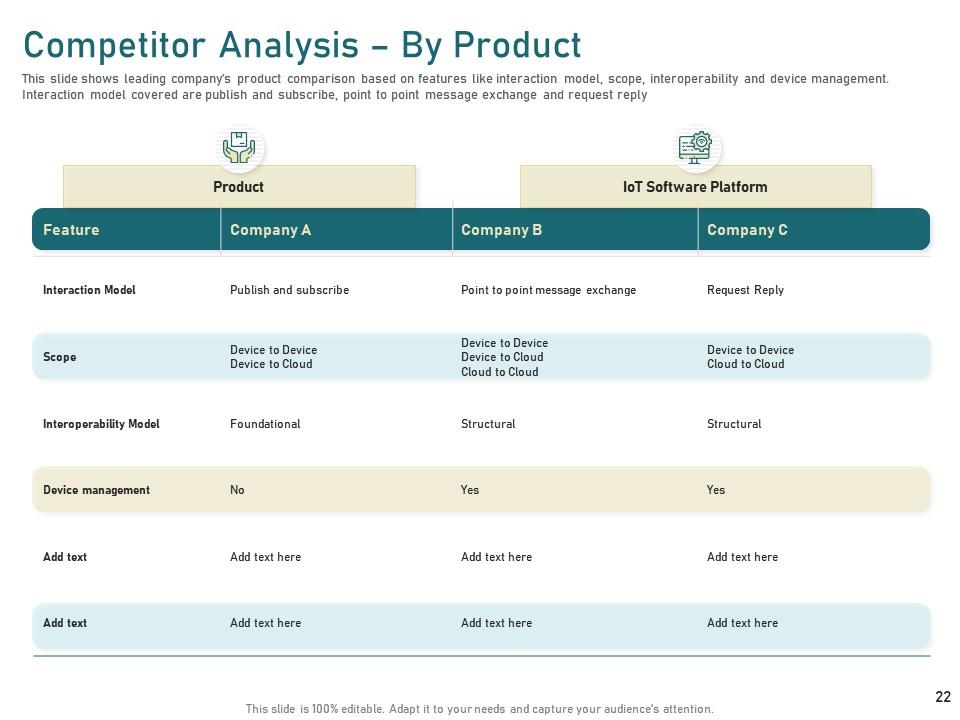
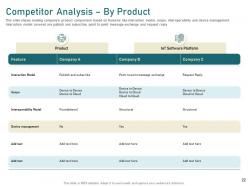
Slide 22: This slide presents the Competitor Analysis – By Product. It shows the leading company’s product comparison based on features like interaction model, scope, interoperability, and device management.
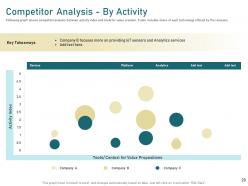
Slide 23: This slide presents the Competitor Analysis - By Activity. The following graph shows competitor analysis between activity index and tools for value creation.
Slide 24: This slide presents the Competitor Analysis - By Price Positioning. The following slide shows the price positioning comparison of leading IoT players.
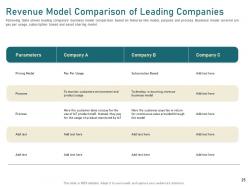
Slide 25: This slide presents the Revenue Model Comparison of Leading Companies. The following table shows the leading company’s business model comparison based on features like model, purpose, and process.
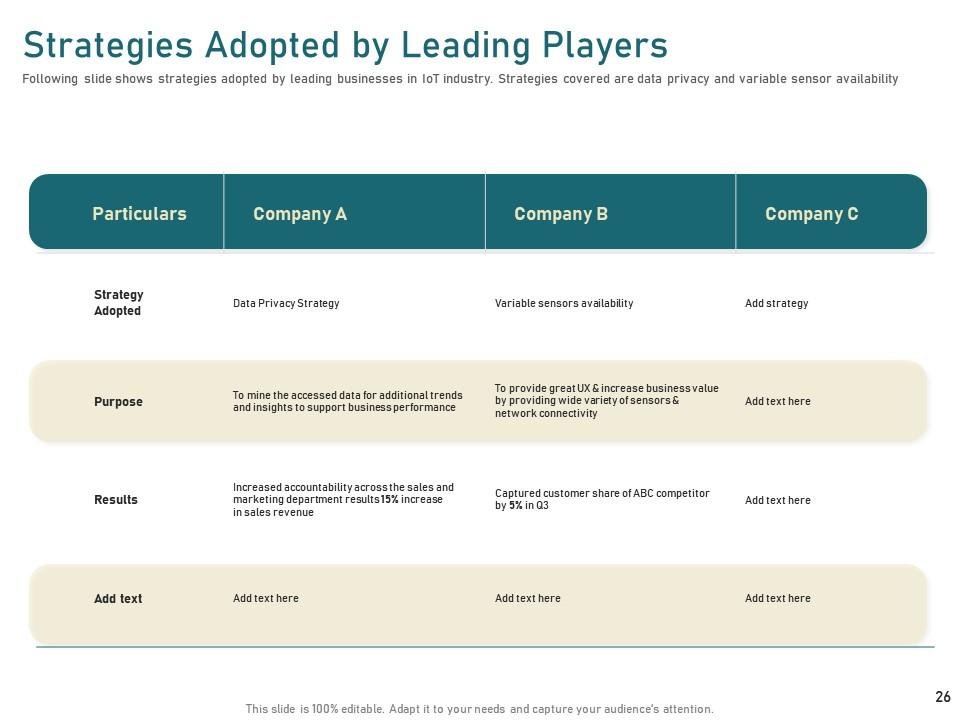
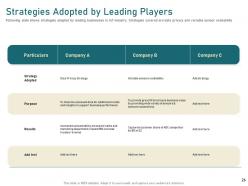
Slide 26: This slide presents the Strategies Adopted by Leading Players. Following slide shows strategies adopted by leading businesses in the IoT industry. Strategies covered are data privacy and variable sensor availability.
Slide 27: This is a table of content slide showing the Customer Insights. It includes - Buyer Personas, Customer Journey Map, and Potential Customer.
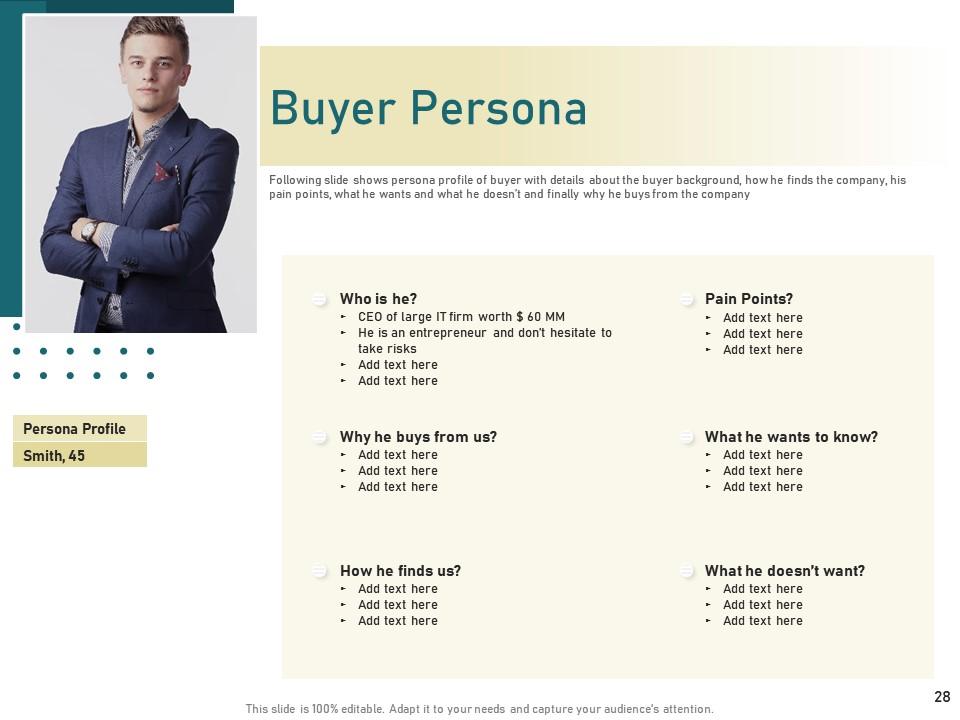
Slide 28: This slide presents the Buyer Persona. It shows the persona profile of the buyer with details about the buyer's background, how he finds the company, his pain points, what he wants and what he doesn’t, and finally why he buys from the company.
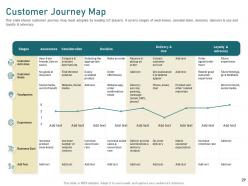
Slide 29: This slide presents the Customer Journey Map. It shows the customer journey map most adopted by leading IoT players. It covers stages of awareness, consideration, decision, delivery & use, and loyalty & advocacy.
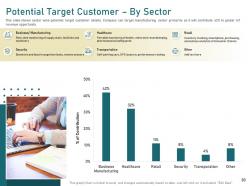
Slide 30: This slide presents the Potential Target Customer – By Sector.
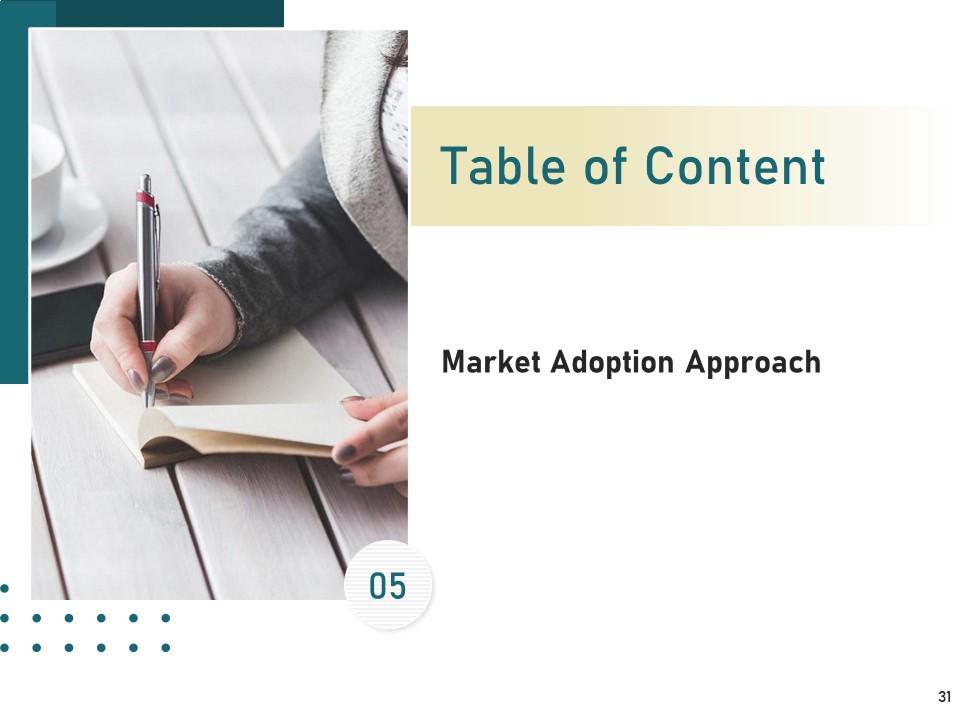
Slide 31: This is a table of content slide showing the Market Adoption Approach.
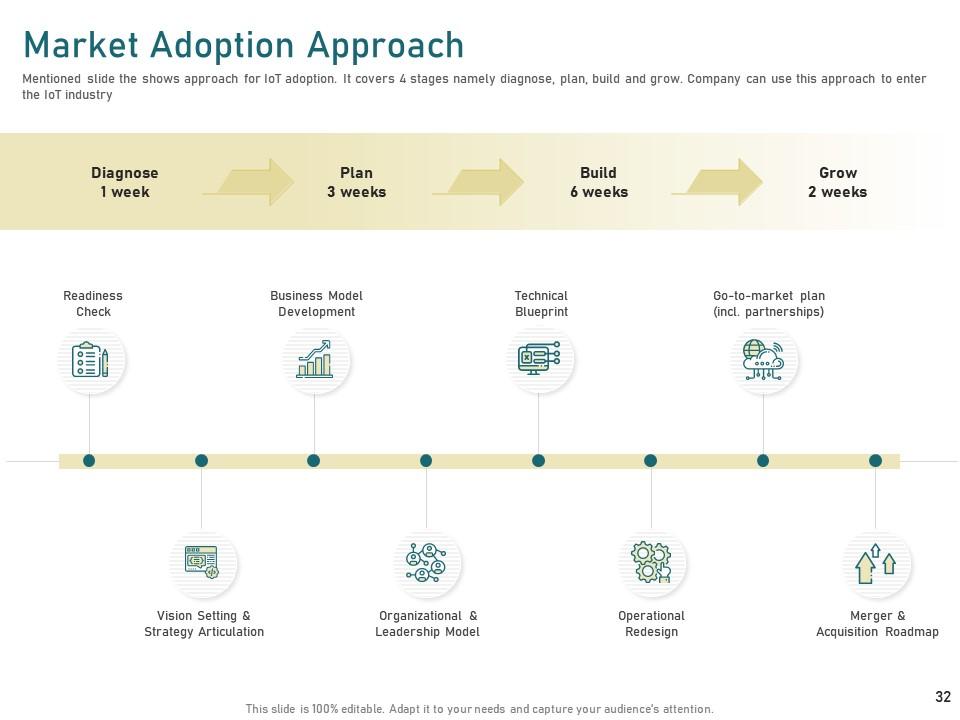
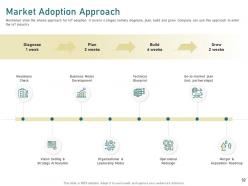
Slide 32: This slide presents the Market Adoption Approach. It shows an approach for IoT adoption. It covers 4 stages namely diagnose, plan, build and grow.
Slide 33: This is a table of content slide showing the Go to Market Strategy. It includes - Pricing Strategy, Marketing Campaign, and Market Forecast.
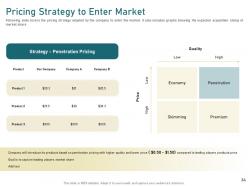
Slide 34: This slide presents the Pricing Strategy to Enter the Market. It covers the pricing strategy adopted by the company to enter the market. It also includes graphs showing the expected acquisition status of market share.
Slide 35: This slide presents the Marketing Campaign of the Company. It explains the marketing campaign of the firm. It includes campaign focus, its goal, duration, target market, marketing channels, the strategy adopted, budget, and expected results.
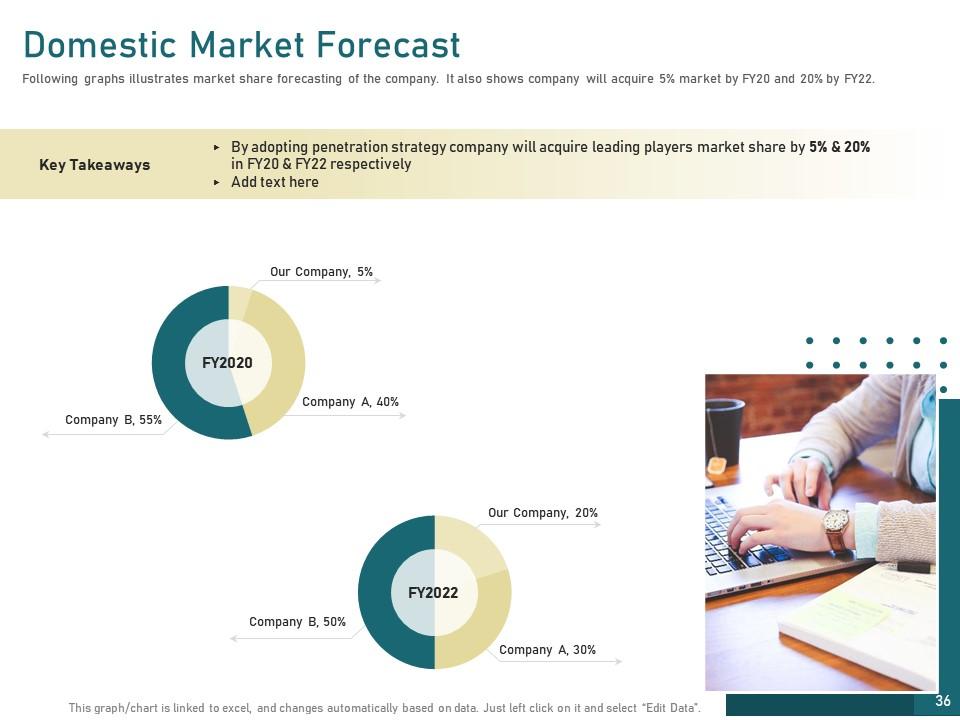
Slide 36: This slide presents the Domestic Market Forecast. It illustrates the market share forecasting of the company.
Slide 37: This is a table of content slide showing the Performance Measurement. It includes - Touchpoint Performance and Dashboards.
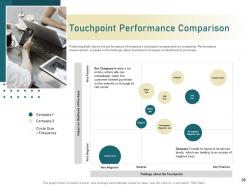
Slide 38: This slide presents the Touchpoint Performance Comparison. Performance measurement is based on the feelings about touchpoint vs impact on the likelihood of purchase
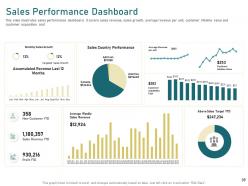
Slide 39: This slide presents the Sales Performance Dashboard. It covers sales revenue, sales growth, average revenue per unit, customer lifetime value, and customer acquisition cost.
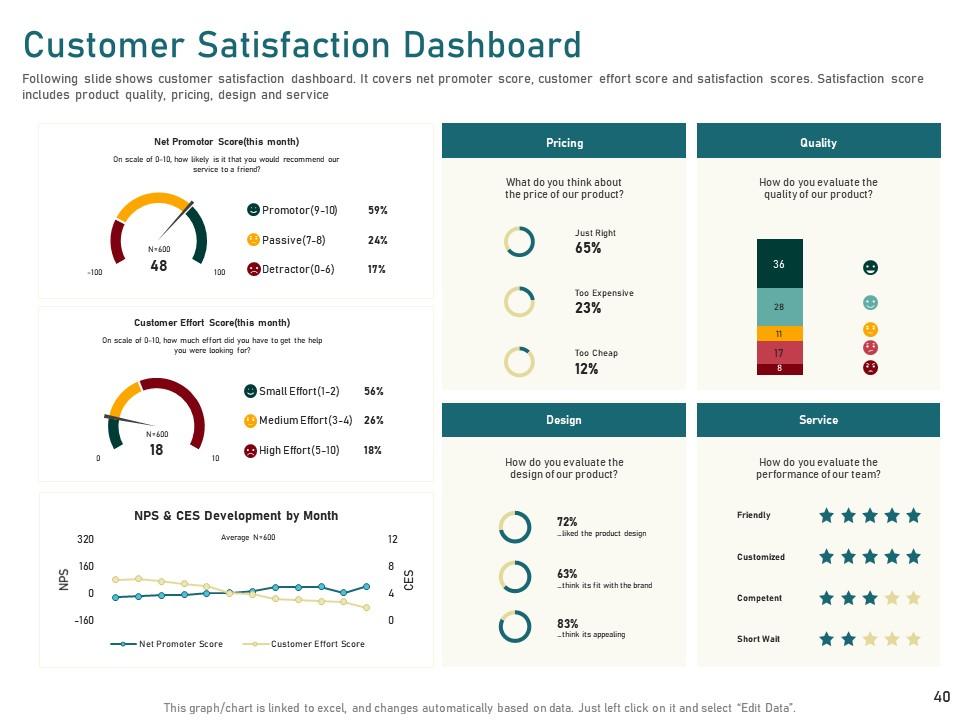
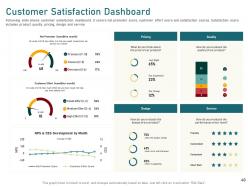
Slide 40: This slide presents the Customer Satisfaction Dashboard. It covers net promoter score, customer effort score, and satisfaction scores. Satisfaction score includes product quality, pricing, design, and service.
Slide 41: This is the Competitive Market Analysis Icons Slide.
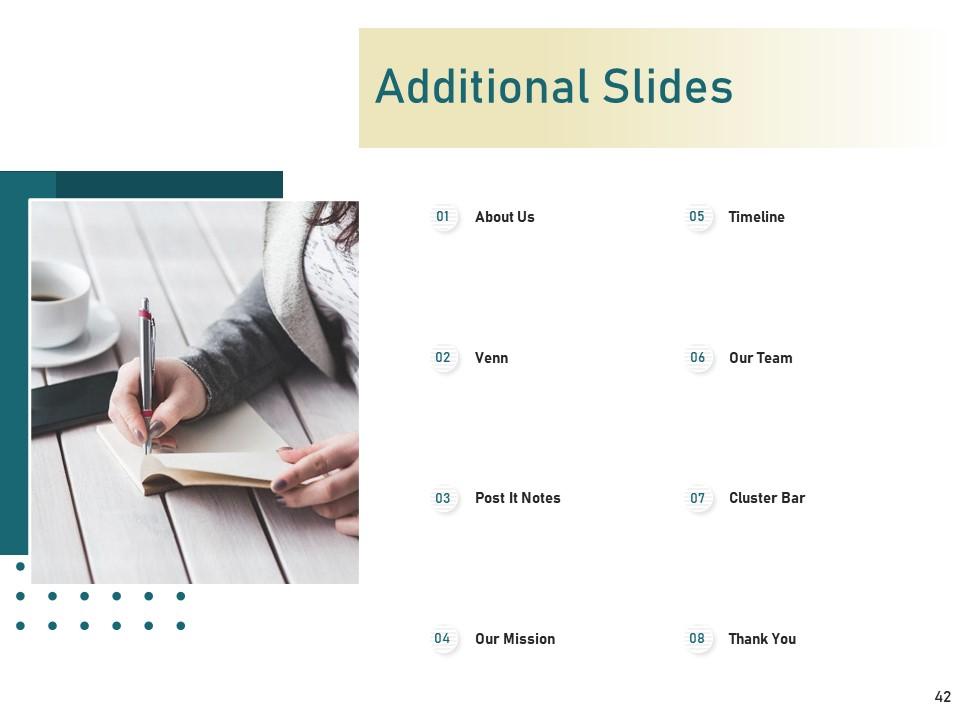
Slide 42: This slide introduces the Additional Slides. It includes - About Us, Venn, Post It Notes, Our Mission, Timeline, Our Team, Cluster Bar, and Thank You.
Slide 43: This slide contains the information about the company aka the ‘About Us’ section. This includes the Value Clients, the Target Audience, We are Creative, and Preferred by Many.
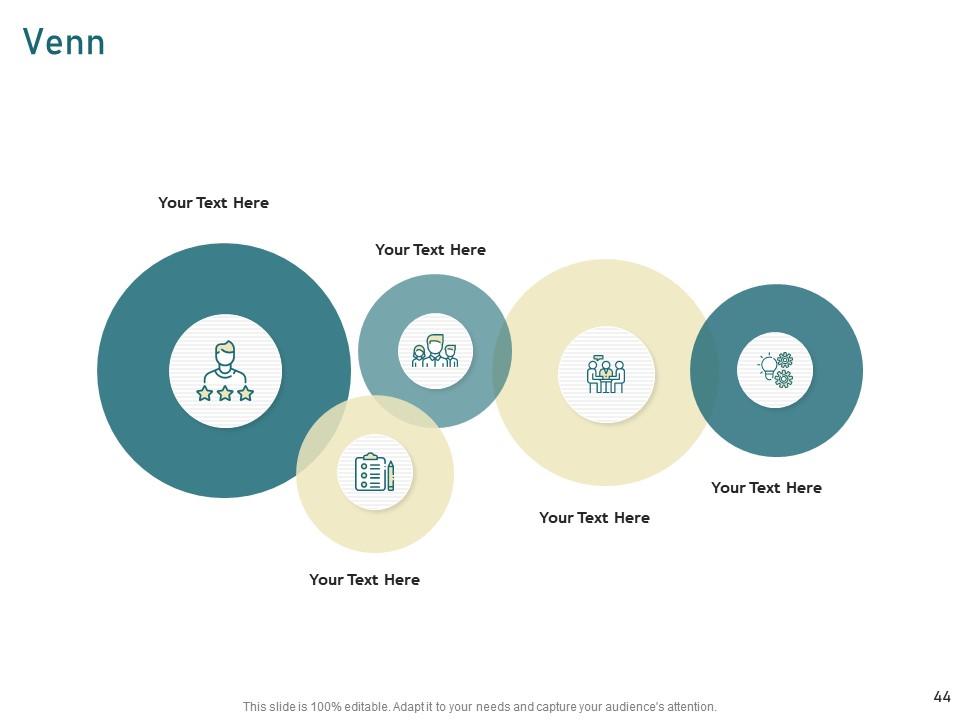
Slide 44: This slide provides a Venn diagram that can be used to show interconnectedness and overlap between various departments, projects, etc.
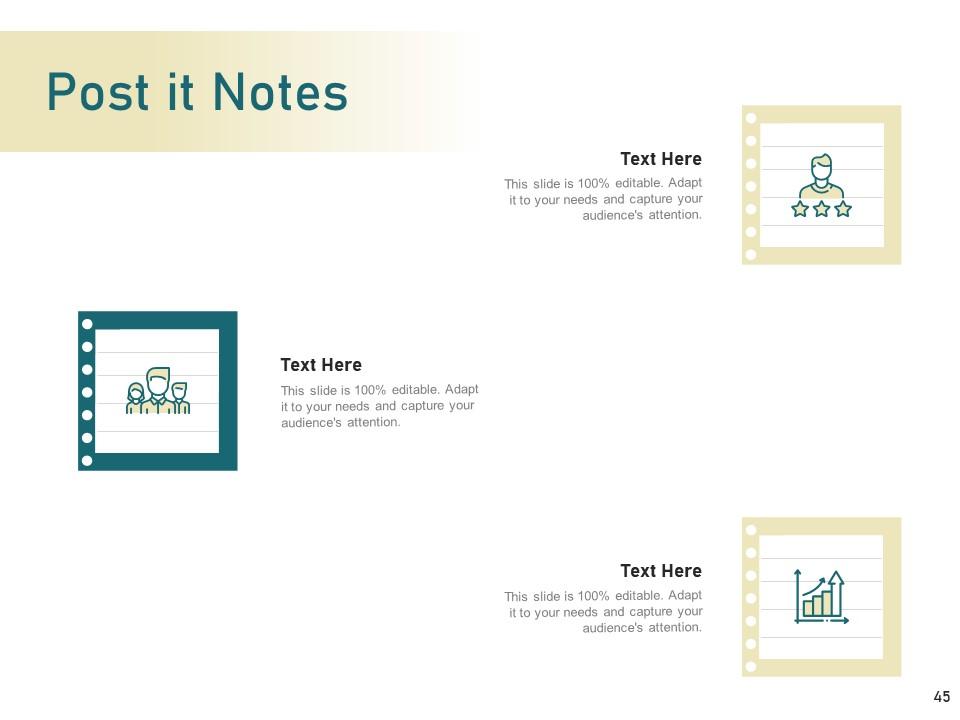
Slide 45: This slide contains Post It Notes that can be used to express any brief thoughts or ideas.
Slide 46: This slide provides the Mission for the entire company. This includes the vision, the mission, and the goal.
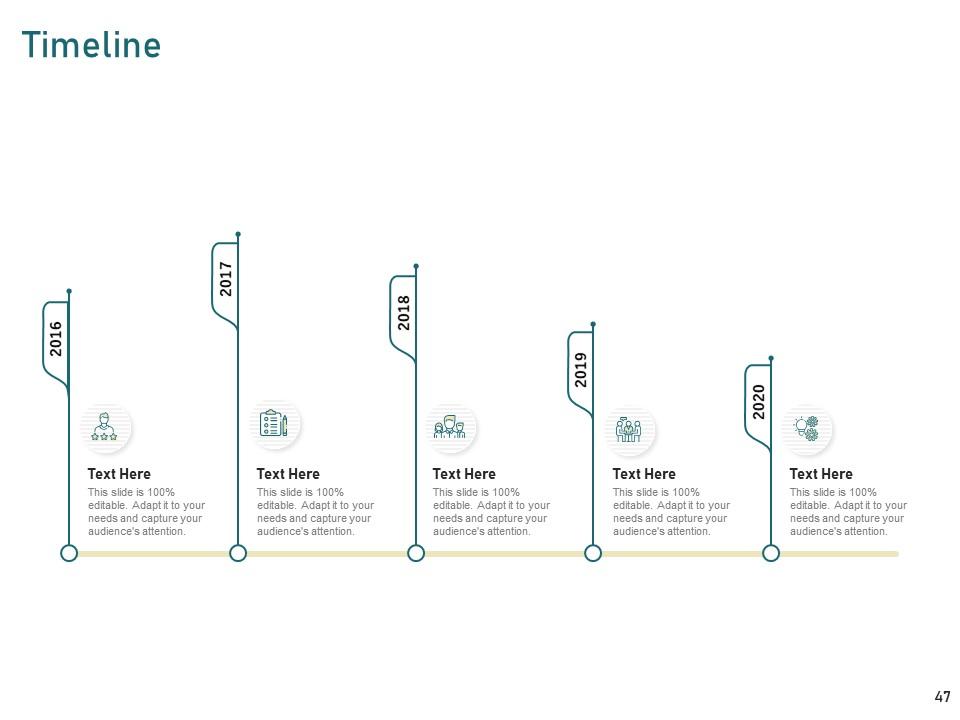
Slide 47: This slide is a Timeline template to showcase the progress of the steps of a project with time.
Slide 48: This slide shows the members of the company team with their name, designation, and photo.
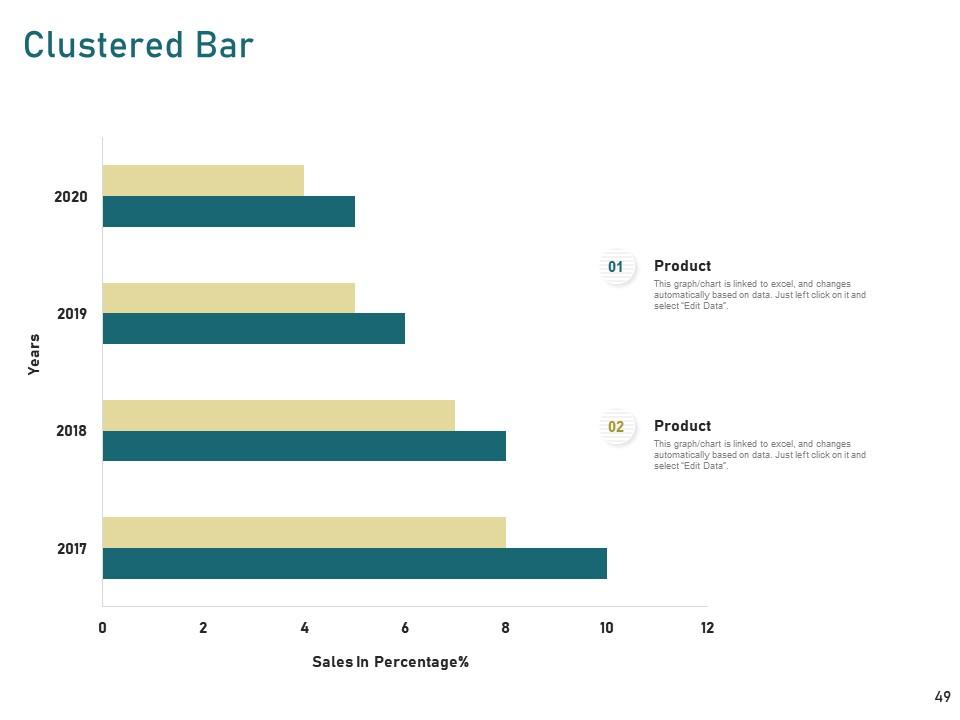
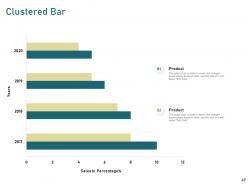
Slide 49: This slide shows a Clustered Bar that compares products’ sales over a timeline of years.
Slide 50: This is a Thank You slide where details such as the address, contact number, email address are added.
Competitive market analysis powerpoint presentation slides with all 50 slides:
Use our Competitive Market Analysis Powerpoint Presentation Slides to effectively help you save your valuable time. They are readymade to fit into any presentation structure.
-
Great designs, really helpful.
-
I discovered this website through a google search, the services matched my needs perfectly and the pricing was very reasonable. I was thrilled with the product and the customer service. I will definitely use their slides again for my presentations and recommend them to other colleagues.
-
Presentation Design is very nice, good work with the content as well.
-
Wonderful templates design to use in business meetings.
-
Enough space for editing and adding your own content.
-
Designs have enough space to add content.
