


Market Research Powerpoint Presentation Slides
Select our content ready Market Research PowerPoint Presentation Slides to create your organization’s strategy. Determine the viability of your new project with this professionally designed market opportunity analysis presentation deck. The strategic marketing plan PowerPoint complete deck comprises ready-to-use templates such as key market drivers, restraint, forecasts, internet of things, food industry, technology market drivers, challenges, etc. Represent various key performance indicators using the self-explanatory business drivers PPT visuals. Make use of the easy to understand market profitability analysis PowerPoint presentation to showcase market research study and its findings. Incorporate professional-looking business analysis PPT visuals to solve marketing problems and make business decisions. Utilize the business growth analysis PowerPoint graphics to link business processes with your company’s strategic goals. Not just this, you can also use the market growth drivers PPT slides to identify new markets and make business policies. Thus, download this high-quality organizational driver's PowerPoint presentation to increase sales and boost profits. You will find our Market Research Powerpoint Presentation Slides to be good company. They enable you to have fruitful conversations.
Select our content ready Market Research PowerPoint Presentation Slides to create your organization’s strategy. Determine t..


-

- Google Slides is a new FREE Presentation software from Google.
- All our content is 100% compatible with Google Slides.
- Just download our designs, and upload them to Google Slides and they will work automatically.
- Amaze your audience with SlideTeam and Google Slides.
-

Want Changes to This PPT Slide? Check out our Presentation Design Services
-

- WideScreen Aspect ratio is becoming a very popular format. When you download this product, the downloaded ZIP will contain this product in both standard and widescreen format.
-

- Some older products that we have may only be in standard format, but they can easily be converted to widescreen.
- To do this, please open the SlideTeam product in Powerpoint, and go to
- Design ( On the top bar) -> Page Setup -> and select "On-screen Show (16:9)” in the drop down for "Slides Sized for".
- The slide or theme will change to widescreen, and all graphics will adjust automatically. You can similarly convert our content to any other desired screen aspect ratio.
Compatible With Google Slides

Get This In WideScreen
You must be logged in to download this presentation.


Do you want to remove this product from your favourites?
PowerPoint presentation slides
The Market Research Powerpoint Presentation Slides are extensively researched. This ready-to-use deck comprises visually stunning PowerPoint templates, icons, visual designs, data-driven charts and graphs, and business diagrams. The deck consists of a total of twenty slides. You can customize this presentation as per your branding needs. You can change the font size, font type, colors as per your requirement. Download PowerPoint templates in both widescreen and standard screen. The presentation is fully supported by Google Slides. It can be easily converted into JPG or PDF format.

People who downloaded this PowerPoint presentation also viewed the following :
Content of this Powerpoint Presentation
A presentation on marketing research can be tricky. With innumerable matrices, aspects, and domains related to any market research, compiling a highly inclusive and thorough research presentation, which also includes the technicalities of the subject matter, becomes troublesome and tiring.
Creating a marketing research presentation from scratch that includes the ins and outs and other specifics of the research is complicated and time-consuming.
A business manager should not have to bother about such a requirement even in the face of urgency. What can help you is a well-versed and pre-designed research template.
As you surf the web for an answer, SlideTeam’s highly adaptable and 100% customizable market research template is just the thing you need. The template offered here is thorough and can help you with all kinds of market research. Don’t believe us? Check out what this template has to offer right below.
To influence your management and investors, you need to show the crux of your research, its findings, and your plans thereon. Here’s a market research outcome template that you can use to do this.
Let’s explore!
Template 1: Market Drivers Template 1
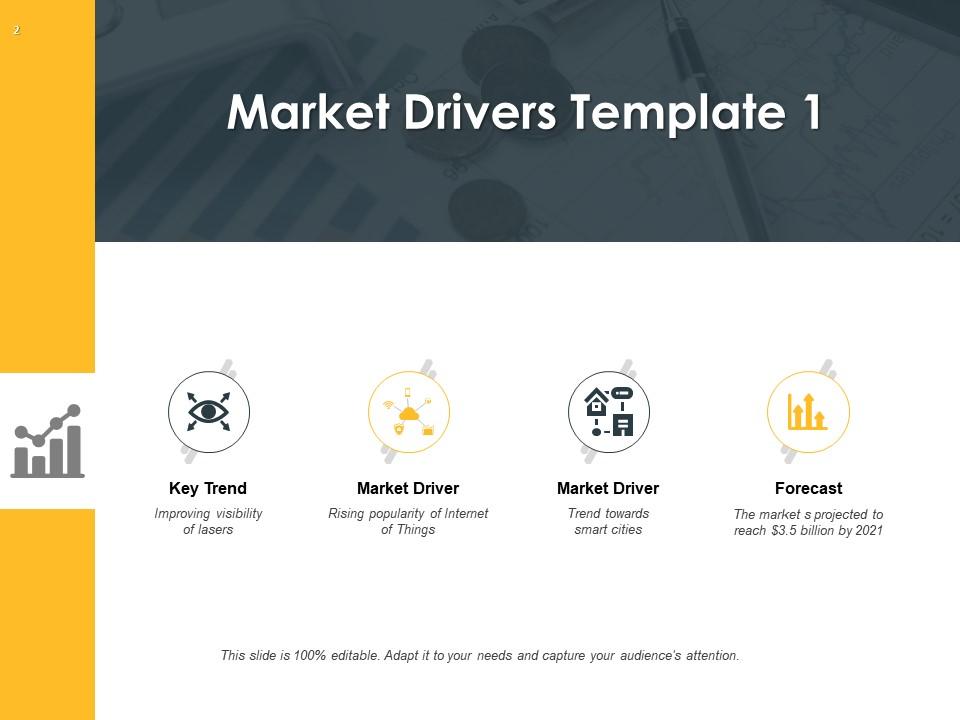
To conduct any market research you first need to understand its trends and other major driving forces. This slide allows you to showcase insights related to the market trends you discovered during your research. Within the slide, you can add some information related to the Key Trends, Market Driving Forces, Forecasts related to the market, and other suitable information. This slide offers the required overview related to conditions prevailing in the market.
Template 2: Market Drivers in terms of numbers
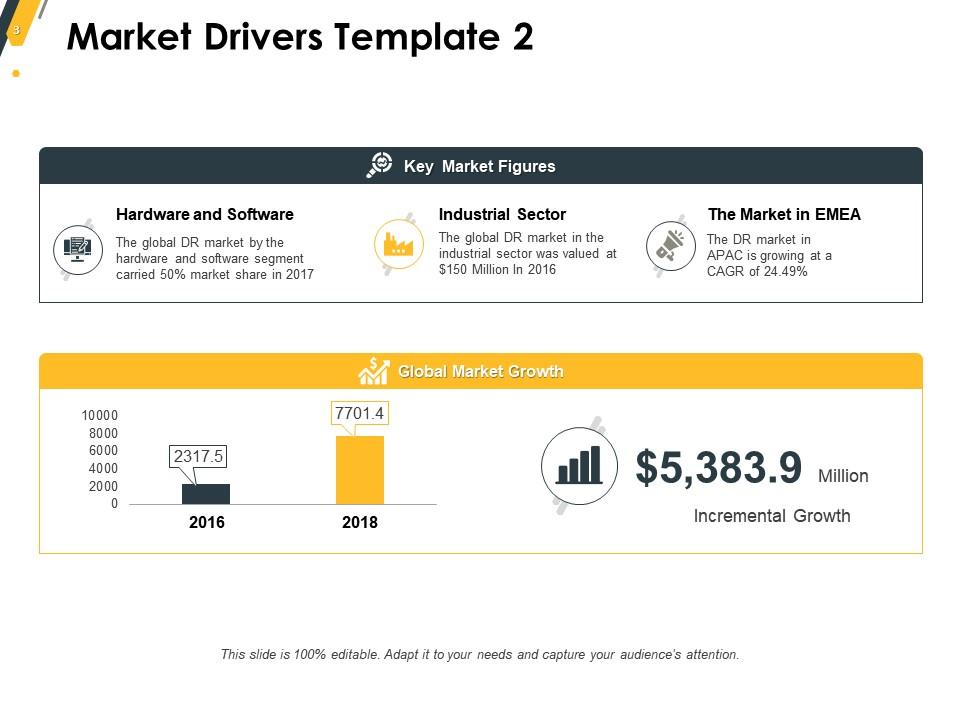
Some individuals in your audience may be interested in gathering information about market-driving forces. To cater to the needs of such individuals, you can take the help of this template as it allows you to include specifics of the previous template. Here, you can showcase the global market growth within a gap of two years. Moreover, you can also add some support text to document the market drivers with suitable information.
Template 3: Market Drivers in terms of Geography and Region
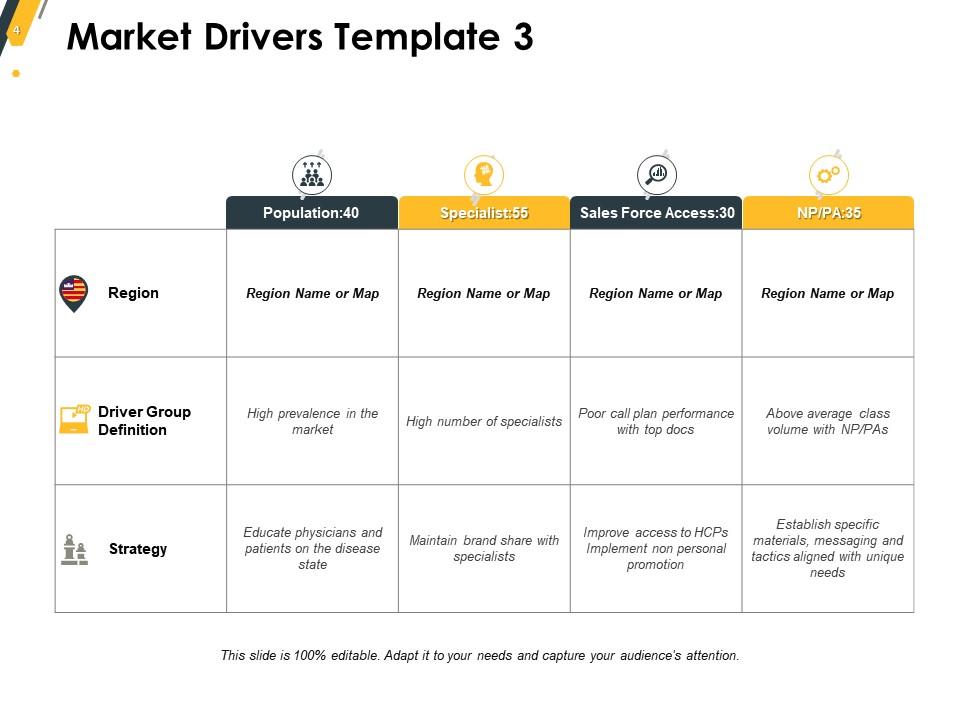
Offering further insights into the previous slide, here’s another one that will allow you to describe the technicalities discovered during the research. In this slide, you will find a table where you can add the driving forces like the population, specialist in the domain, sales force access, and NA/PA. In the rows of the table, you can showcase the region of research, the definition of the driver groups, and the strategies devised for the area after the research.
Template 4: Market Drivers and Factors Unique to Businesses
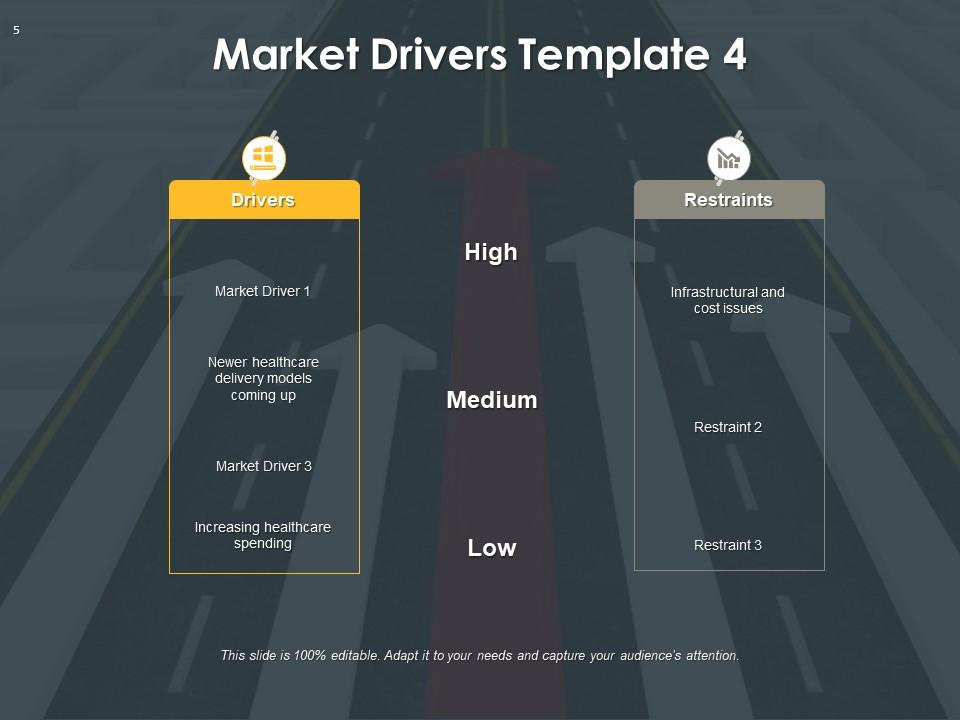
This market drivers template is quite different from the previous ones. This slide showcases the market driving forces and their major restraints. All the drivers and restraints are put one above another to showcase the impact of the driver and its restraint. The one added above represents a higher impact. The market drivers found during the research could be an increase in healthcare spending in the market. This market driver is shown at the bottom and hence has the least impact.
Template 5: Key Market Drivers and Restraints
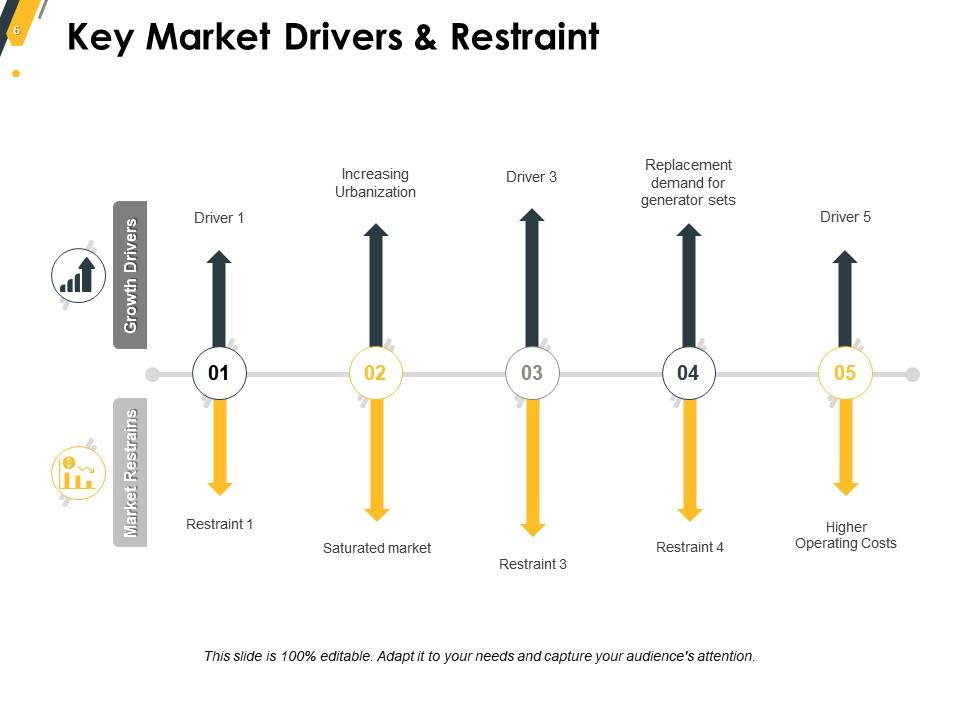
This market research template allows you to showcase the major market drivers against individual and most impacting restraints. For example, consider that one of the most prominent market drivers is increased urbanization. The main constraint that this market driving force has faced is a saturated market. Similarly, the greatest restraint to some other market driver would be some other restraint that you have found during your research.
Template 6: Key Market Drivers and Forecasts
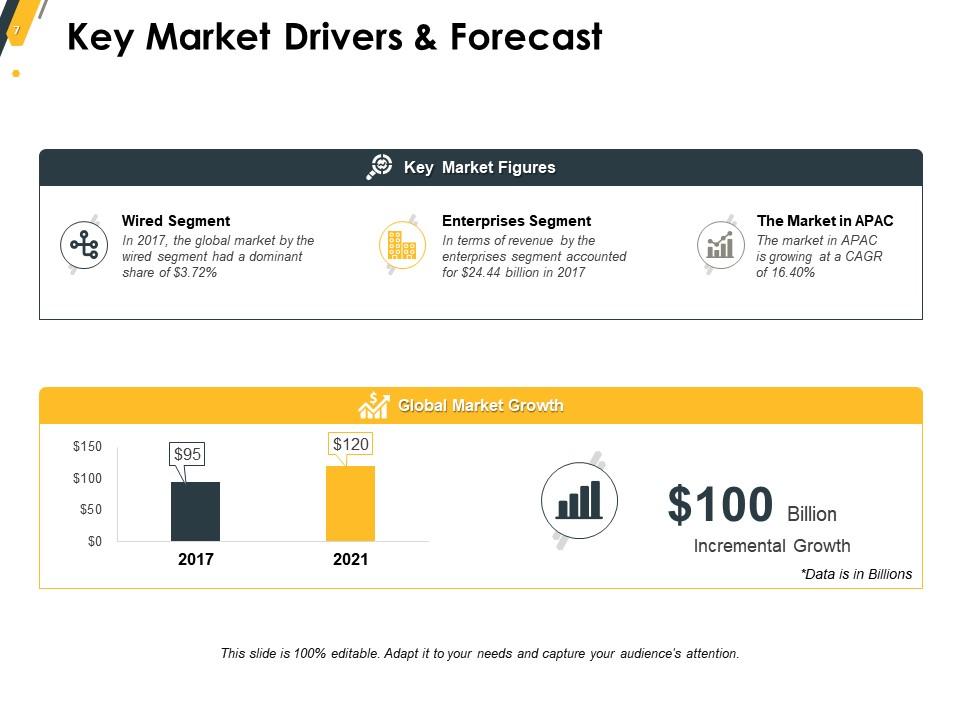
Now that you know which are the prominent restraints to markets as mapped to the forces, you need a document that can also help you with its forecasts. This slide allows you to make and enlist forecasts according to the market research. The key market figures to be added in this slide can be showcased as well. You can also showcase the global market growth for a better understanding.
Template 7: Internet of Things Market Drivers
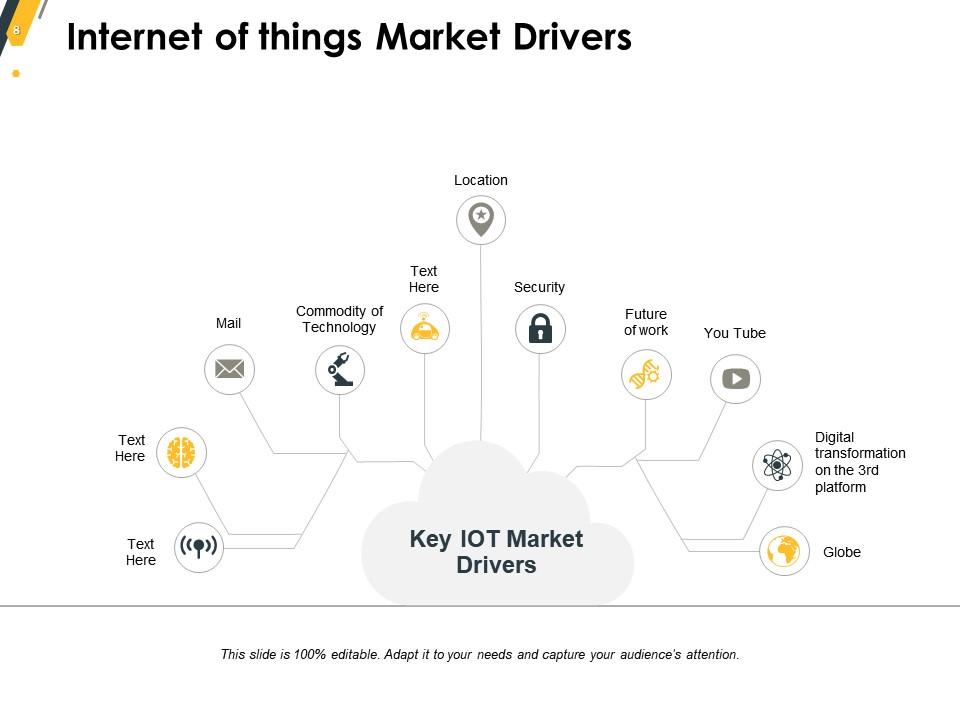
The Internet of Things is gaining huge popularity these days and proved to be beneficial for businesses. This slide allows you to showcase the relation of the market drivers with respect to the Internet of Things. The key IoT market drivers that you can add in this slide can be the commodity of technology, security, YouTube insights, digital transportation, global effects, location, the future of work, emails, social media, and so much more.
Template 8: Food Industry Market Drivers
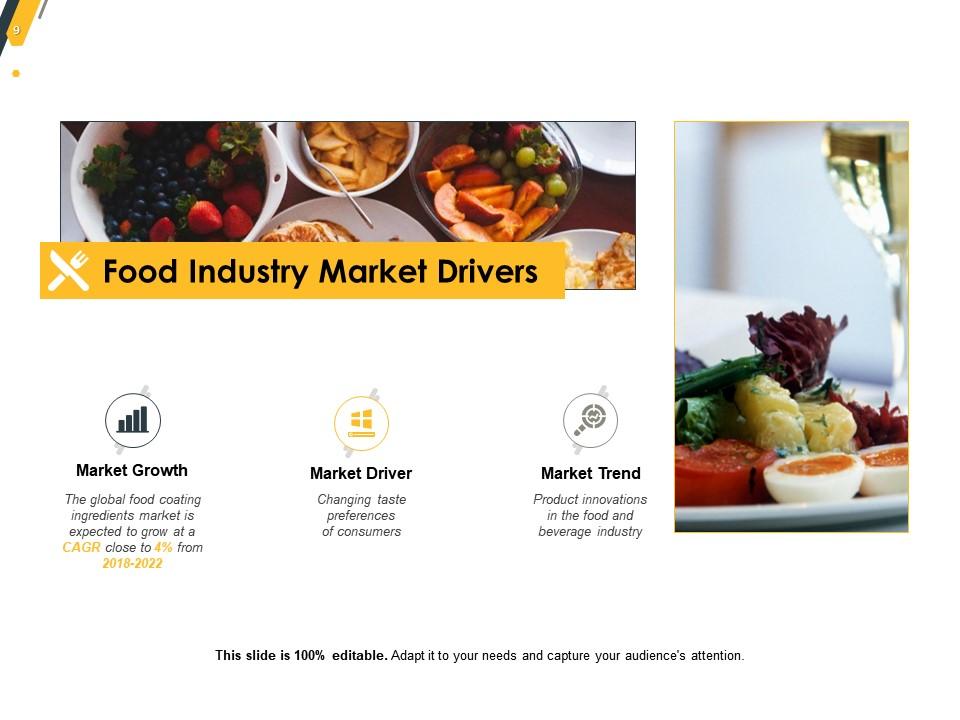
If you are involved with the food industry, then this slide is helpful in showcasing major forces that drive the food industry. The slide allows you to represent the main attributes of the market growth in the food industry which is 4% per annum. Similarly, the major market driving force in this domain is the ever-changing tastes and preferences of the customers. Lastly, you can also showcase the food industry’s main market trend, which is the continuous innovations in food and beverages.
Template 9: Business and Technology Drivers and Restraints
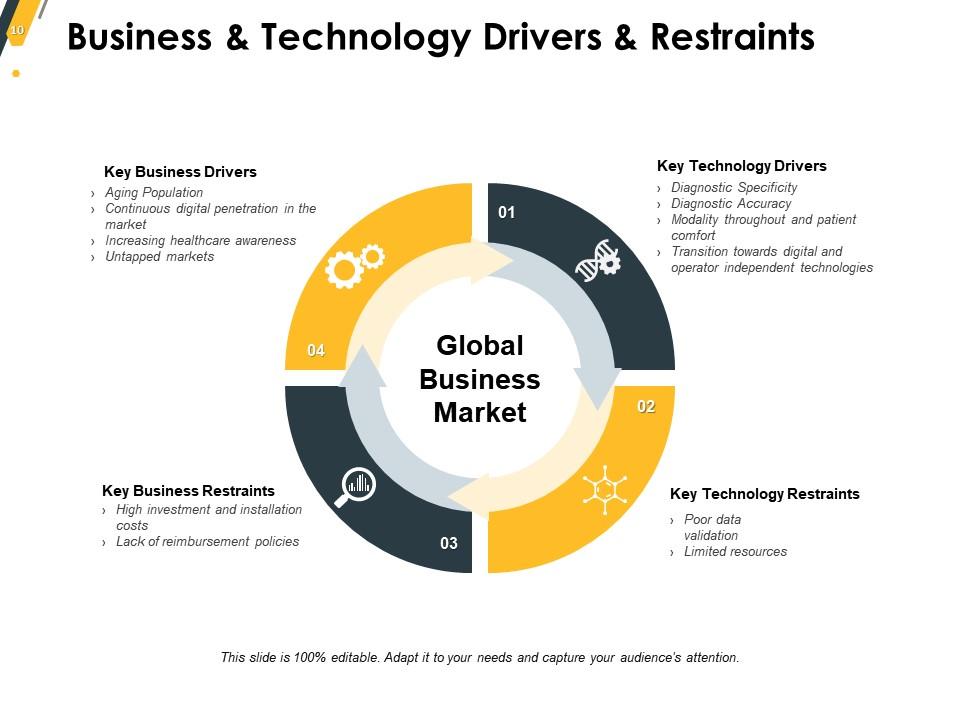
In this innovative world of technology, changes are bound to happen. You can prepare your business in a way that can use the most out of technological advancements. This slide allows you to represent your research insights related to the market’s main driving forces, and their restraints, with respect to technology. You can showcase both the drivers and restraints in the business and the technological world. You can include aspects like the aging population, untapped markets, and more.
Template 10: Market Drivers and Restraints Template
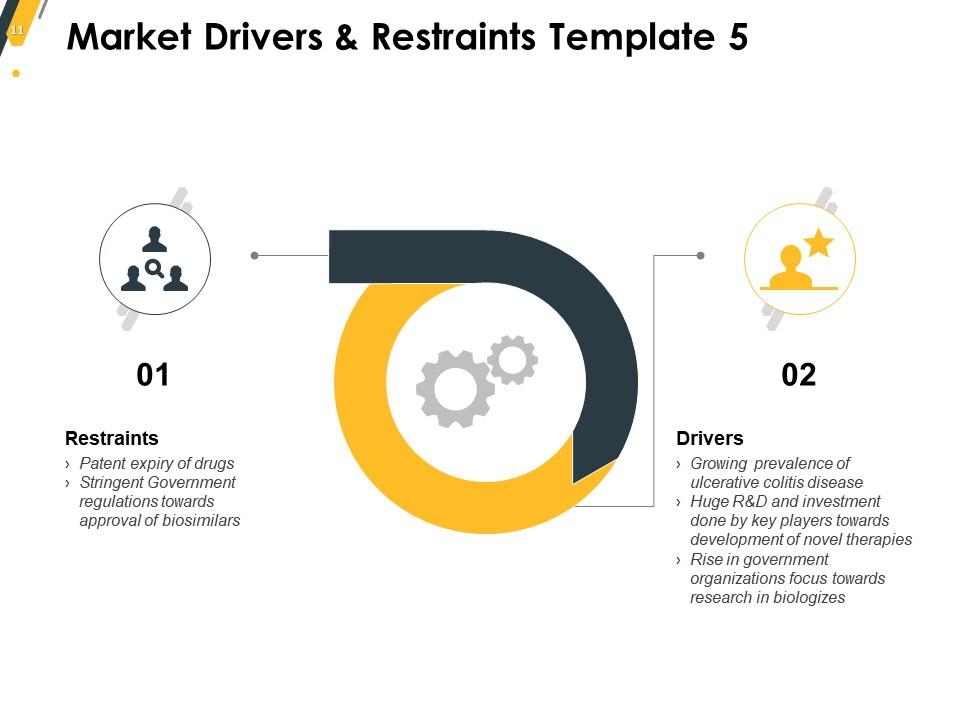
Here’s another inclusive template that allows you to place the restraints and market drivers side by side. These drivers and restraints may or may not be related to one another. The restraints can give rise to factors like patent expiry of drugs and stringent government regulations toward approval of biosimilars. For the drivers part, you can add factors like the growing prevalence of ulcerative colitis disease and huge R&D and investment done by key players towards development and more.
Here’s a smart template that will allow you to showcase the entire marketing research process to your audience in a feasible manner.
Get Your Research's Worth with Smart Representation
Undergoing thorough research is not sufficient enough. The research would go to waste if not used in a well-composed manner. The above template will help you align the facts with the format and make it easy for you to display and showcase the research, its implications, and findings in a way that’s beneficial for your business and informational for your audience.
Do you wish to enlighten your audience about the process you use for extensive market research? You can try the template offered here.
Market Research Powerpoint Presentation Slides with all 20 slides:
Use our Market Research Powerpoint Presentation Slides to effectively help you save your valuable time. They are readymade to fit into any presentation structure.
-
Commendable slides with attractive designs. Extremely pleased with the fact that they are easy to modify. Great work!
-
Very well designed and informative templates.
