

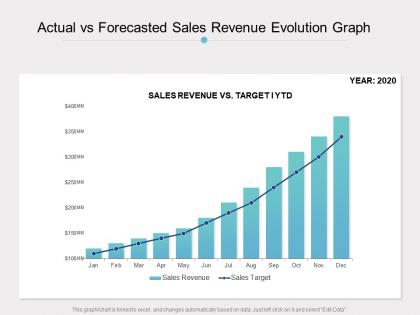
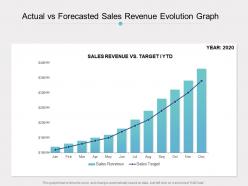
Actual vs forecasted sales revenue evolution graph




Try Before you Buy Download Free Sample Product
 Impress Your
 Audience
 100%
100% Editable
 Save Hours
 of Time


Our Actual Vs Forecasted Sales Revenue Evolution Graph are topically designed to provide an attractive backdrop to any subject. Use them to look like a presentation pro.
People who downloaded this PowerPoint presentation also viewed the following :
Actual vs forecasted sales revenue evolution graph with all 2 slides:
Use our Actual Vs Forecasted Sales Revenue Evolution Graph to effectively help you save your valuable time. They are readymade to fit into any presentation structure.
FAQs for Actual vs forecasted sales
Start with the big three: total revenue, growth rate, and average deal size. Then check your funnel conversion rates and track customer acquisition cost vs lifetime value - that's where the real money story is. Sales cycle length matters way more than people think (seriously, measure this!). Break everything down by product, rep, and customer type so you can actually see patterns. Oh, and don't overcomplicate it at first. These basics will show you what's broken and what's crushing it in your sales process.
Your business probably has those predictable ups and downs that happen every year - like retail crushing it during holidays or camping gear flying off shelves in summer. The slow seasons suck for cash flow, but at least they're predictable! Look at your year-over-year numbers instead of comparing month to month - that's where you'll actually see the patterns. Once you figure out your specific cycles, you can plan better. Stock up before busy periods, maybe run promotions during the dead zones. Honestly makes forecasting way less of a guessing game.
Honestly, customer segmentation is like having a cheat code for your business. You'll see which groups actually make you money vs the ones just taking up space. Break down your sales by demographics, buying habits, company size - whatever makes sense. The patterns you find will blow your mind compared to looking at everything together. High volume doesn't always mean high profit, trust me on this one. I know companies that totally flipped their strategy once they figured out their "favorite" customers were actually draining them. Start with revenue per customer in each segment, then dig into acquisition costs and lifetime value. Game changer.
So I'd start with basic stuff like moving averages and regression analysis - they're solid for spotting patterns in your historical data. Pipeline metrics and website traffic can be super helpful too since they usually predict what's coming. Honestly, way too many sales teams just wing it based on feelings (spoiler alert: disaster waiting to happen). Time series models are clutch if your data's consistent. But definitely get input from your actual sales people about big deals in the pipeline or weird market stuff happening. A 3-month moving average is perfect to start with, then you can get fancier once you figure out what actually works for predicting your numbers.
Start by diving into your historical sales data - it's honestly crazy how much you can learn about customer behavior just from looking at patterns. Year-over-year growth will show you the big picture trends. Then break everything down by time periods, product lines, sales channels, whatever makes sense for your business. Seasonal stuff usually jumps out pretty quick too. I'd also look at which products or regions are totally crushing it versus the ones that... aren't. The whole point is figuring out what's actually driving results so you can hit those revenue targets instead of just hoping for the best.
Dude, pricing is literally make-or-break for revenue. Go too cheap and yeah, you'll move units but your margins are toast. Price high? Sales tank even though you're making bank per purchase. It's all about finding that middle ground based on what your customers actually think you're worth. I remember this one company - they bumped revenue like 25% just by tweaking their price points, which is wild when you think about it. You should totally test different pricing with your audience. A/B test that stuff and see what clicks.
So basically, stuff like inflation and interest rates mess with how much people spend, which hits your sales hard. Good economy = people buy more freely. Recession or crazy inflation? Everyone tightens up - I mean, look at grocery prices right now, it's insane. Interest rates kill big purchases too since loans get pricey. Track economic indicators with your sales numbers so you can actually see the patterns. Honestly helps you predict what's coming instead of just guessing. Consumer confidence is huge too - if people feel broke, they'll skip buying anything non-essential.
Honestly, just start with Excel or Google Sheets - they cover like 80% of what you'll actually need for sales tracking. Pivot tables are your friend here. Once you outgrow spreadsheets (and trust me, you'll know when), then look at Tableau or Power BI. Both are pretty powerful but yeah, there's definitely a learning curve. Oh, and if you're already using Salesforce, their built-in reporting isn't terrible. HubSpot's got decent analytics too. My advice? Don't overthink it at first. Figure out what metrics actually matter to your team with basic tools, then upgrade when you know exactly what you're trying to track.
Dude, don't just stare at the raw numbers - they'll drive you crazy. Look at what's actually causing those swings first. Is it seasonal stuff? Maybe you ran a big campaign that month? Economic weirdness in your area? Honestly, I see people freak out over totally normal month-to-month ups and downs all the time. Pull back and check your quarterly trends instead. That's where the real story is. Compare everything against your past data and what other businesses in your space are seeing. Half the time what looks scary is just regular business noise. The trick is figuring out what's actually worth worrying about.
Dude, biggest mistake is just looking at raw revenue numbers. You're missing the whole story without profit margins and customer acquisition costs. Don't mix different product lines or time periods either - that's comparing apples to oranges. I used to cherry-pick my best months all the time (guilty as charged), but it just screws you over later. Returns and refunds matter too - they add up fast. Here's what actually works: break everything down by product, channel, and customer type first. Way more useful than those big flashy totals that don't tell you anything real.
Honestly, revenue analysis is just figuring out what's actually making you money vs. what's bleeding you dry. Look at your data monthly by product, region, customer type - whatever makes sense for your business. You'll start seeing patterns pretty quick. Maybe that new product everyone was hyped about is tanking, or one region is crushing it while another's dead weight. The trick is watching trends, not just one-off months (because December's always weird anyway). Once you see what's working, throw more resources there. Dump the losers. Sounds harsh but your bank account will thank you.
Yeah, marketing and sales usually go hand in hand, but it's messier than people think. Paid ads hit fast - sometimes within days. Social media though? That's a slow burn that can take months to pay off, which is honestly annoying when you're trying to prove ROI. The real trick is figuring out what's actually working versus what just looks good on paper. Set up your tracking system first - and I mean really nail it down - then wait at least 3-6 months before making any big decisions. Don't expect a perfect straight line either.
Pull your last quarter's numbers and rank deals by size plus close rate - that's your starting point. Which products or territories are killing it? Dig into what's actually working there. Honestly, it's like being a detective and I love that part. Your individual stats vs team averages will show you where you're winning and where you need backup. Focus on your highest-value activities and customer segments, then double down hard on those. Sometimes the patterns jump out at you right away, other times you gotta hunt for the gaps that'll really make a difference.
Look at your own numbers first - pull the last 12 months and see if you're actually growing month to month. That's your baseline right there. Then try to find industry data or competitor info (good luck with that one, but worth a shot). The ratios that really matter though? Revenue per customer, what it costs to get new customers, and lifetime value. Honestly, those internal metrics tell you way more than comparing yourself to other companies anyway. Growth rates are where I'd start - just calculate how you're doing quarter over quarter and you'll know if you're on track.
So quarterly reviews are standard, but that's honestly pretty bare minimum. I'd check your key numbers weekly, maybe daily if you're in a fast-moving business. Monthly deep-dives work great for spotting trends early - way better than scrambling to fix stuff later. Those quarterly sessions are where you get into the real strategic analysis, year-over-year comparisons, seasonal patterns, forecast tweaks. Oh and if you're not doing formal reviews yet? Just start monthly. You can always ramp up the frequency once you find your groove.
-
Out of the box and creative design.
-
Best Representation of topics, really appreciable.
-
The content is very helpful from business point of view.
-
Great experience, I would definitely use your services further.