Every business looks forward to generating enough sales revenue to make a net profit. Because of this, business holders and their sales teams should observe the increase and decrease in sales closely. It is essential to keep track of sales regularly, be it monthly, or quarterly. To do this, we need to have the sales number in text or numerical format to be compared and analyzed. But sometimes it is hard to understand numbers as they are, so we use visuals and graphs to show the data in a way that's easy to understand. That's why we create sales charts.
Visual data representation enables us to grasp the information with incredible speed, accuracy, and accessibility. Incorporating sales graphs or charts into our reports or presentations significantly enhances their clarity, whether we are trying to emphasize a trend or compare sales figures.
This blog brings you the Top 7 Sales Chart Templates to help you track your sales data. These PPT Slides are content-ready and 100% editable to save you time, effort, and money. Let’s check them out!
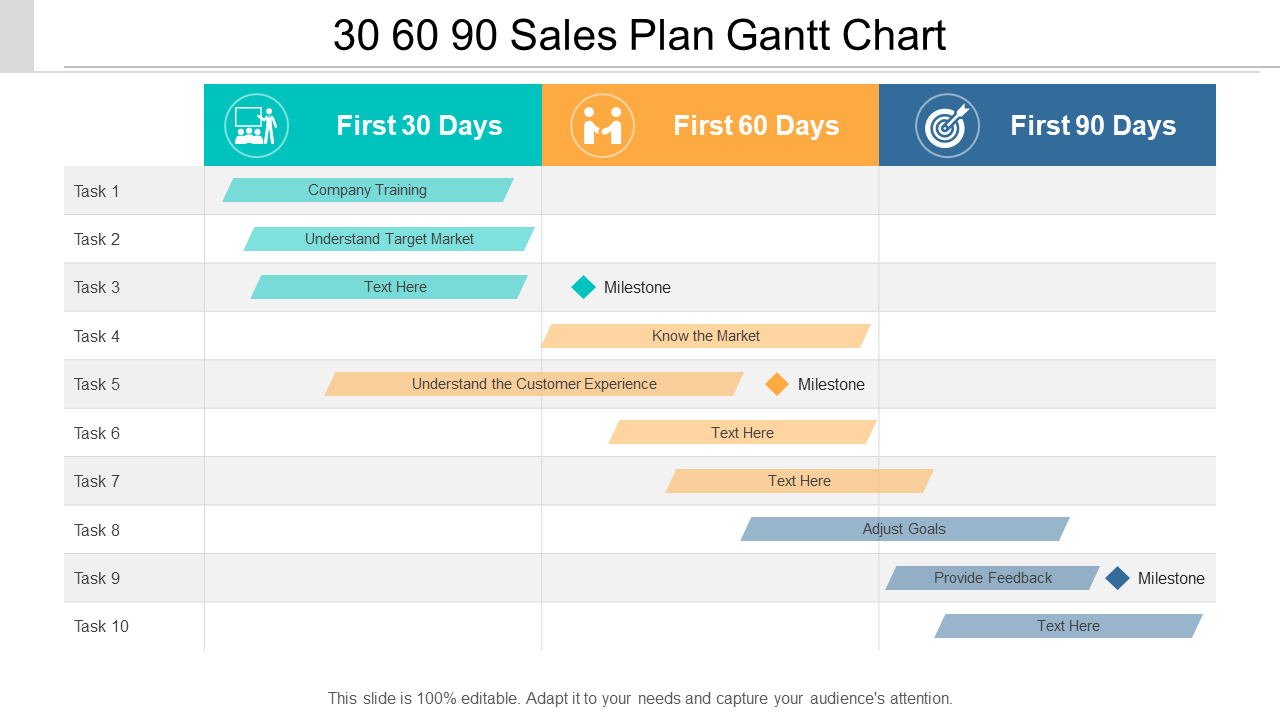
Templates 1: 30-60-90 Sales Plan Gantt Chart
Do you need a Gantt chart for your Sales team? This PPT Template displays the company training being undertaken and showcases employee performance for their first 30 days. It sets the milestones, helps you understand the customer, and presents the market information for 60 days of the plan. You can also adjust the goal and provide feedback in 90 days. Download this PPT Slide and make a stunning sales plan.
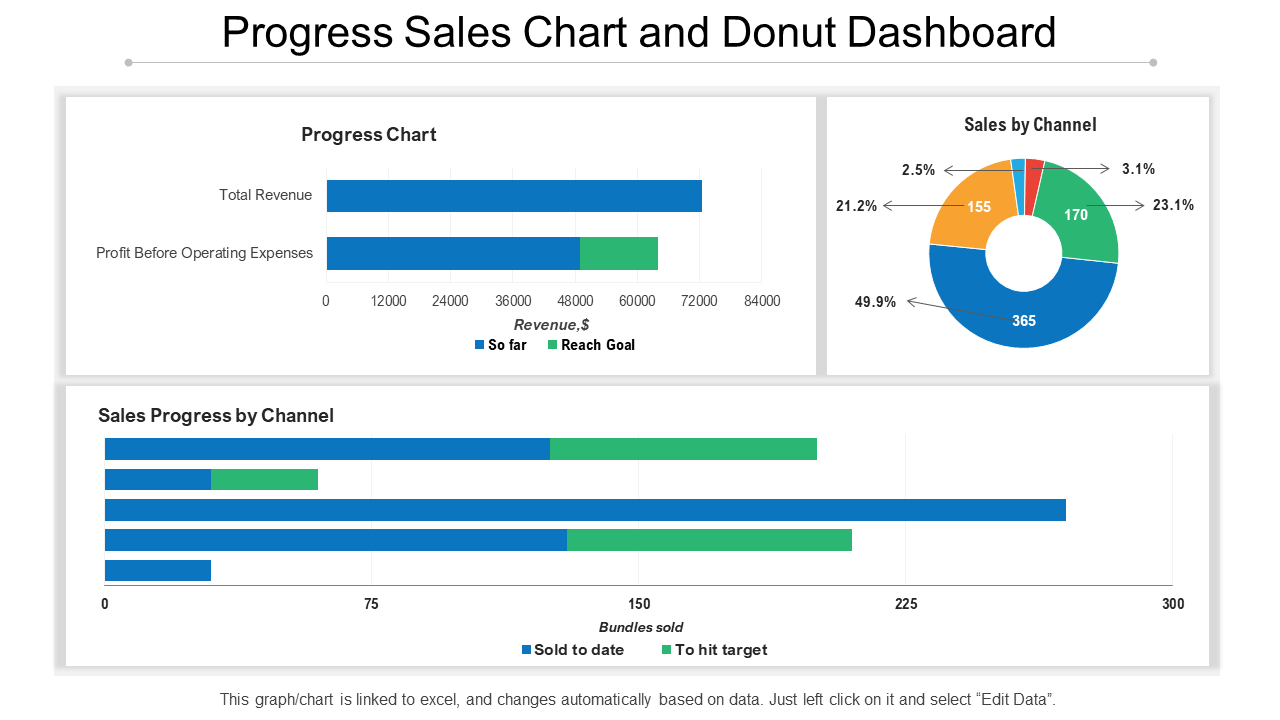
Template 2: Progress Sales Chart and Donut Dashboard
Utilize this PowerPoint Presentation Design to keep track of your company's total revenue, profit, and operating expenses. With the help of a pie chart, you can track sales growth for the particular channel. This PPT Template also has a bar chart that helps in presenting the sales program by channel. Grab this content-ready template now to build an effective sales chart.
Template 3: Products Sales Chart Data Presentation
This PPT Slide can be utilized to present the sales data in your presentations. This slide includes a pie chart that you can use to share the sales distribution of different products. Also, a bar chart is used to showcase the product sales. Grab this PPT Layout!
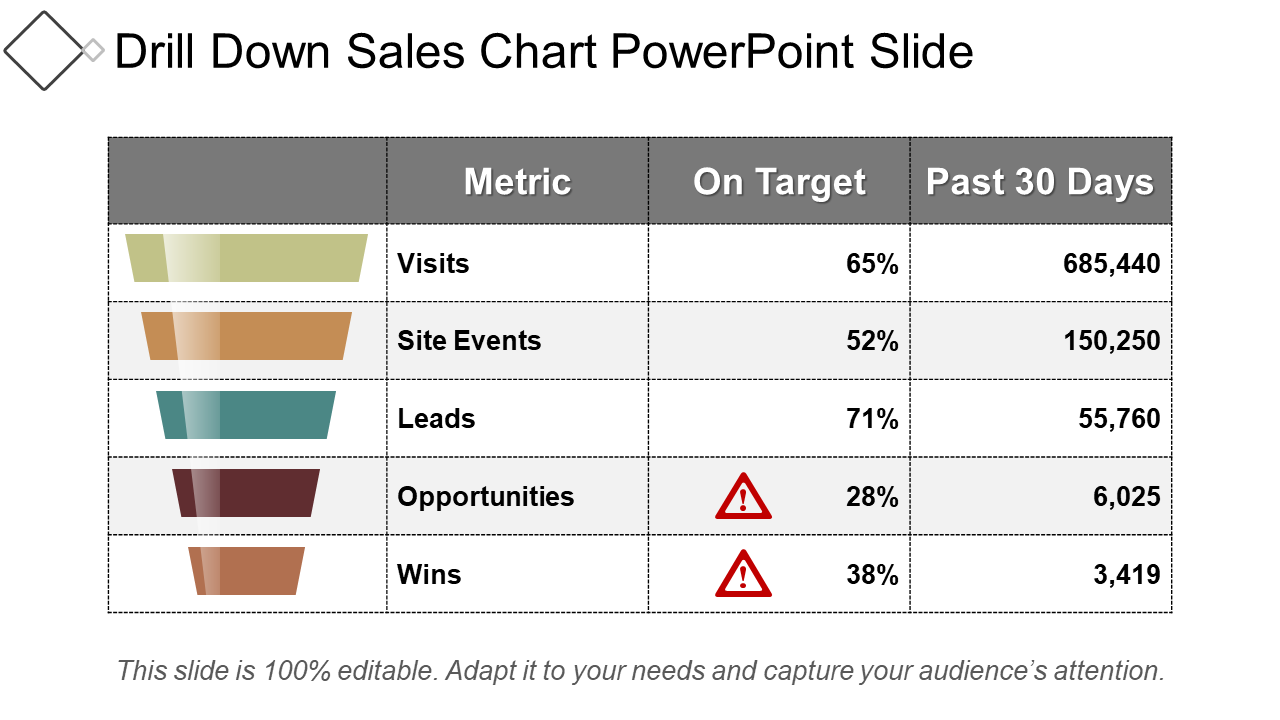
Template 4: Drill Down Sales Chart PowerPoint Slide
You can use this sales chart PowerPoint Slide to deliver the sales trends analysis for your business. This PPT Preset provides valuable insight into the inner workings of the business and helps you take important decisions for the pricing strategies. The funnel-shaped sales charts help in identifying potential opportunities and problems in your business. This template also helps in tracking the performance of your products by monitoring metrics, targets, and the number of days. Use this PPT Template to make an outstanding PowerPoint Presentation.
Template 5: Automobile Sales Chart Comparison with Yearly Growth
Check out our PowerPoint Templates on Automobile Sales . This slide features a sales chart that enables organizations to compare the sales of four automobiles over a period of13 years and devise corrective strategies in case of deviations. This PowerPoint Presentation is accessible and can be customized to suit your needs. Download it now and impress your audience with valuable insights.
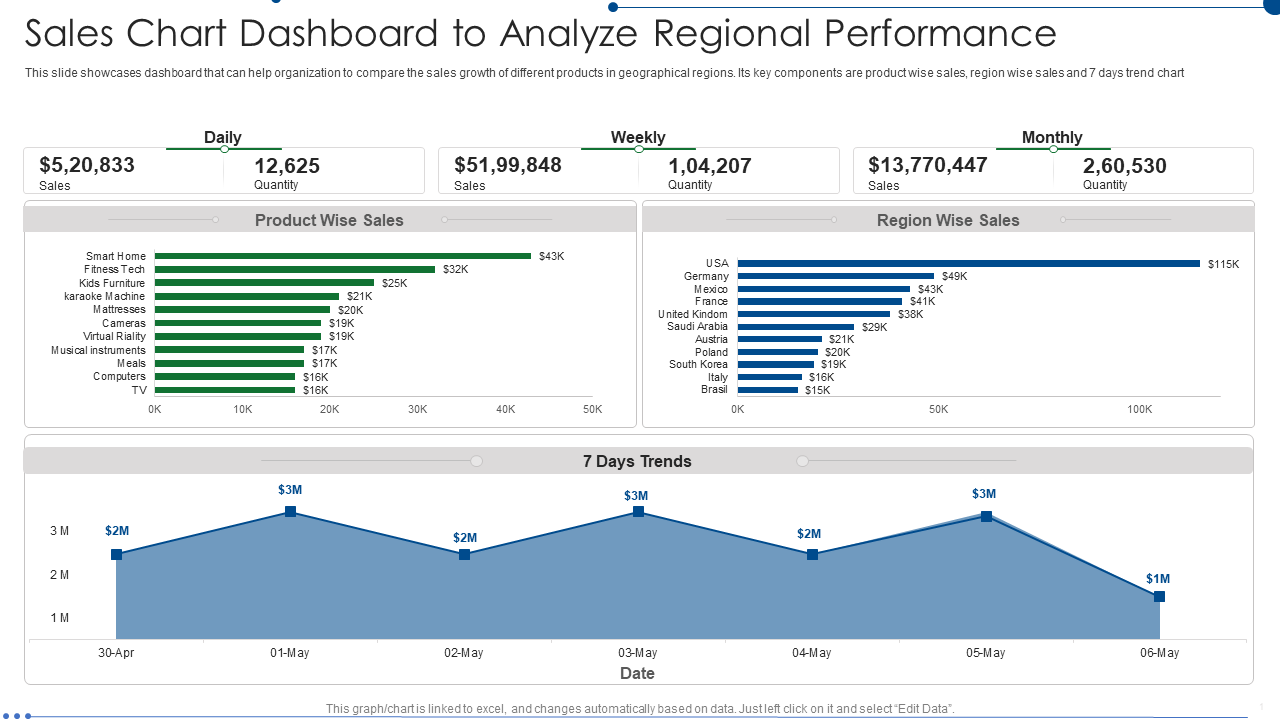
Template 6: Sales Chart Dashboard to Analyze Regional Performance
We present our Sales Chart Dashboard to analyze the regional performance. This dashboard enables organizations to compare the sales growth of various products in different geographical regions, with key components including product-wise sales, region-wise sales, and a 7-day trend chart. This PowerPoint Presentation is imminently available and completely customizable to suit your needs. Get it now to impress your audience with valuable insights to help your organization make informed decisions on sales strategies.
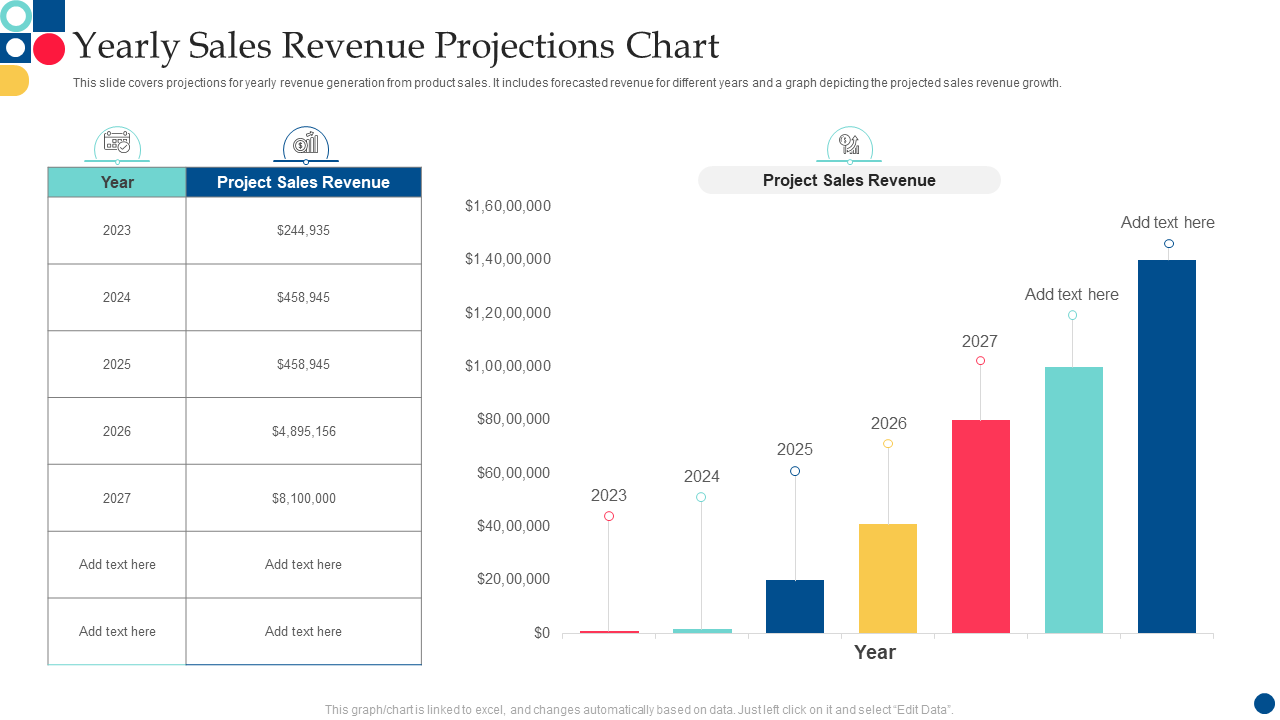
Template 7: Yearly Sales Revenue Projection Chart
Do you need to present your sales revenue projection in a chart? This slide features the forecasted revenue for different years and a graph depicting the projected sales revenue growth, providing valuable insights into your organization's potential revenue generation from product sales.
Template 8: Sales Report Chart with Price Per Unit
Use this presentation design as an attractive backdrop for any subject related to sales reporting. This PowerPoint Presentation includes a Sales Report Chart for categories such as electronics, grocery, clothing, etc. This presentation is full-editable and can be easily customized to suit your needs. Download it now and present your data in a professional manner.
Conclusion
Each sale helps you improve your operations, making them more informed, economical, and adaptable, creating a booming business in our hyper-connected digital age. Use these sales charts and graphs as tools for your sales dashboard so you can always have actionable insights available at an instant.
FAQs on Sales Charts
What is a sales chart?
A sales chart is a visual representation of sales information over a given time frame. Businesses use it to track trends and visualize sales performance. Sales charts can be used to assess the success of marketing campaigns and discover seasonal trends. They can also be used to define goals for sales teams and anticipate upcoming sales. Sales charts offer insightful information about a company's performance and assist organizations in making better choices to increase sales and profitability.
How do you make a sales chart?
For making sales chart you must perform the following general procedures in order to build a sales chart:
- Collecting sales information: Get the sales information for the precise time frame that you wish to see on the chart. This information must be current and correct.
- Select a type of chart: Choose the type of chart that will best represent your sales information line charts, bar charts, and pie charts are the three most popular forms.
- Sort your data: Depending on the type of chart you are making, sort your sales data into categories or time period. Organize your data, for instance, by product or location if you are making a bar chart.
- Fill out spreadsheet or other program with data:
- Make a chart of your own by including titles, labels, and other graphics components. Also, you might want to pick colors that will make your chart simple to read and understand.
- Evaluate or distribute: Check that your chart clearly and understandably conveys the information while reflecting your sales statistics. Share the chart with anyone who requires the sales data after you are satisfied with it.
What chart is best for sale?
There are no specific charts that are best for sale. You can use charts depending on the particular sale information you want to convey. The type of data being presented and the audience who will be watching the chart will determine the idea chart for sale. Here are a few typical graphs that help to boost your sales.
You can choose any chart depending on how you present your data in your company.
- Line chart: In order to track a sale success over a period of weeks, months, or years a line chart is an excellent tool for displaying patterns over time.
- Bar graph: This diagram is helpful for contrasting various data types. It can be used to contrast sales results between various markets, geographical areas or time frames.
- Pie chart: This diagram is useful for displaying the percentage of sales produced by various goods or areas. It may be useful for emphasizing the markets or products that sell the best.
- Spread plot: This diagram is helpful for determining connection between various elements, for spending on marketing and sales. It is beneficial for finding patterns or connections that could be relevant while making sales decisions.


 Customer Reviews

