


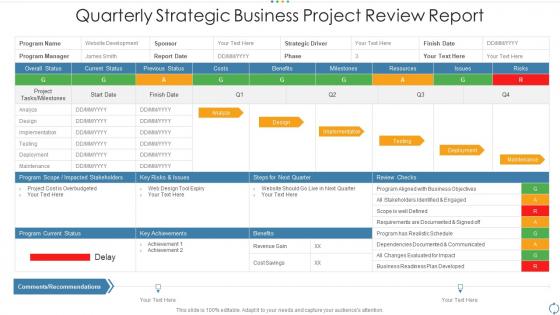
Quarterly strategic business project review report




Try Before you Buy Download Free Sample Product
 Impress Your
Audience
 100%
Editable
 Save Hours
of Time


Our Quarterly Strategic Business Project Review Report are topically designed to provide an attractive backdrop to any subject. Use them to look like a presentation pro.
People who downloaded this PowerPoint presentation also viewed the following :
Quarterly strategic business project review report with all 9 slides:
Use our Quarterly Strategic Business Project Review Report to effectively help you save your valuable time. They are readymade to fit into any presentation structure.







FAQs for Quarterly strategic business
For your quarterly review, cover the basics first - revenue, expenses, key metrics. Then highlight your biggest wins and how you tackled any roadblocks. Charts and graphs are your friend here because honestly, nobody wants to stare at endless spreadsheet rows. Connect everything back to company goals so the higher-ups can see you're not just doing busy work. Share 2-3 insights you picked up along the way. Oh, and set your goals for next quarter too. Focus on telling a coherent story rather than just throwing random updates at people.
Honestly, charts and graphs will save your life here. Nobody wants to stare at endless spreadsheet rows during quarterly reviews - your brain just glazes over. With visuals, you can actually see if that Q2 drop was part of a trend or just random bad luck. Bar charts and line graphs are perfect for comparing quarters side-by-side. Your stakeholders will get the whole picture in seconds instead of pretending to understand tables of numbers (we've all been there). Don't overthink the tools either - simple visuals make a massive difference. Way better than death by PowerPoint slides full of data.
Stick to the stuff that actually matters for your business - revenue growth, customer acquisition costs, and retention rates. Those website visit numbers? Total vanity metric unless people are actually buying. Also track your burn rate and profit margins, plus whatever's specific to your industry. Honestly, I learned this the hard way - too many metrics just becomes noise. Pick like 5-7 max and throw them on a simple dashboard. Quarter-to-quarter comparisons make it super obvious when something's trending up or down. Way better than drowning in spreadsheets.
Ugh, I used to bomb presentations because I'd use the same deck for everyone. Big mistake. Now I totally switch up my approach. Executives? Hit them with the financial stuff and big picture strategy right away - they don't have time for details. Your actual team needs the nitty-gritty operational stuff since that's what they deal with every day. Client stakeholders are different though - they only care about outcomes that hit them directly, plus what happens next. I literally rearrange the same data with different opening slides now. Before I start, I ask myself what decision this specific audience needs to make. Makes all the difference.
Honestly, the worst thing you can do is just throw a bunch of charts at people without any story connecting them. Like, I've sat through so many of these where someone just reads numbers off slides - it's painful. Don't waste time dwelling on what went wrong either (we all know stuff didn't go perfectly). Jump to the lessons learned and next quarter's plan instead. Oh, and definitely test your screen sharing beforehand - nothing kills momentum like fumbling with tech for five minutes. You want people actually discussing your insights, not checking their phones.
Honestly, just turn your data into actual stories. Like, don't just throw numbers at people - walk them through what happened. Your Q1 customer acquisition was trash? Cool, now show how that new campaign totally turned things around in Q2. Make it a journey with characters and plot twists. People zone out during boring presentations, but everyone loves a good story. Use that problem-solution-outcome thing for each big project. I swear it works way better than just slides full of charts. Try starting sections with "So here's what went down..." instead of the usual corporate speak. Makes such a difference.
Honestly, just nail the visuals and keep your branding consistent - that alone will make yours way better than the usual slide disasters everyone sits through. Charts should actually tell a story, not just be number dumps. Before/after comparisons are chef's kiss for showing impact. Stick to a simple color scheme, maybe your company colors or just one accent color throughout. Don't cram everything together either - white space saves lives lol. Oh, and create one standout slide that showcases your biggest quarterly win. Makes such a difference when you have that one slide that really pops.
Honestly, I'd start updating like 2-3 weeks before each meeting. But here's what I actually do - just spend 30 minutes every month refreshing the numbers and adding quick notes about what's happening. Way less stressful than scrambling last minute (learned that the hard way). The main structure stays pretty much the same each time. Just swap in new data, call out any big wins or problems that popped up, and tweak your projections based on reality. Set a monthly reminder or you'll totally forget. Trust me, quarterly reviews suck way less when you're not pulling an all-nighter beforehand.
Look, feedback is what actually makes quarterly reviews better instead of just another waste of time. Ask your team specific stuff like "Did this help with your goals?" - not those boring satisfaction surveys nobody cares about. People always have opinions about meetings anyway (trust me on this), so you might as well use it. Get input from everyone - team members, managers, yourself too. Then tweak your format or timing based on what you hear. It's pretty much the only way to know if you're having real conversations or just checking boxes.
Start with your biggest wins and main challenges - tell a story instead of just dumping data everywhere. I usually pick 3-4 themes since that's honestly all anyone remembers anyway. Throw in specific numbers when they actually matter, but don't go overboard with every metric you tracked (nobody cares about your click-through rates on that one random email). Charts and bullet points are your friend - way better than giant text blocks. Oh, and always end each section with what you're changing next quarter based on what didn't work. Makes you look thoughtful.
Ditch the spreadsheet overload - seriously, nobody wants to squint at tiny numbers. Charts and graphs are your best friend here. I'd start big picture, then zoom into the details that actually matter. Always show how you're doing vs last quarter and your original projections, otherwise people are lost. Clean slides with key points in normal language, not accounting speak. Oh, and prep those backup slides explaining any weird variances because someone will definitely ask "but why did this tank?" You'll thank me later when you're not scrambling for answers.
Oh absolutely do a wins section! I'm terrible at tracking stuff throughout the quarter so I always scramble at the end lol. Get specific achievements from everyone - actual numbers work best like "cut processing time by 30%" instead of vague "worked really hard" nonsense. Definitely include team wins too where everyone contributed to something big. Individual shoutouts are clutch for morale. Pro tip: connect your wins back to company goals so the higher-ups actually get why your team rocks.
Honestly, Canva's been a lifesaver for me - makes decent slides without wanting to throw your laptop out the window. PowerPoint's Designer thing is actually not terrible anymore if you're stuck with Microsoft stuff. For charts and data, Tableau's solid but Google Data Studio works too and it's free. Oh, and definitely get your data organized first in something like Notion or Airtable. I learned that one the hard way after staying up until 2am trying to find last quarter's numbers. Just pick whatever plays nice with where your data already lives.
Oh yeah, this is so real! Germans will straight-up tell you what's wrong right away, but Japanese colleagues spend way more time on context and making sure everyone feels good about the discussion first. It's wild how different the same meeting can feel. What I've learned is you gotta switch up your approach - like sending agendas early for teams that need prep time, or honestly just blocking out more time when you're working with relationship-focused cultures. The feedback's usually the same quality either way, just takes different paths to get there.
Definitely get those next steps nailed down while everything's still fresh. I'd shoot out a follow-up email within 24 hours covering the main decisions and who's doing what by when. Trust me, you'll thank yourself later when nobody's confused about assignments. Schedule any check-ins for the bigger stuff that got discussed. Oh, and update whatever project tracker you're using - I know it's annoying but it actually helps. The whole point is avoiding that nightmare scenario where everyone's pointing fingers because nothing got documented properly.
-
Best Representation of topics, really appreciable.
-
It saves your time and decrease your efforts in half.
-
Very unique and reliable designs.
-
Innovative and attractive designs.