


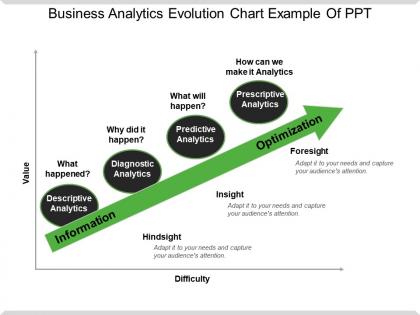
Business analytics evolution chart example of ppt


Try Before you Buy Download Free Sample Product
 Impress Your
 Audience
Editable
of Time


Elucidate your business performance with this Business Analytics Evolution Chart Example Of PPT template. Showcase the various types of analysis such as descriptive analytics, diagnostic analytics, predictive analysis, etc. with this organization analysis PowerPoint graph. Employ this business process graphic and have a greater insight into the most critical areas of the analysis process. Add crucial information such as agenda, AI outline, components, key statistics, survey on adoption of emerging technologies, etc. in this company research visual. Utilize this business engineering diagram and depict the role of AI in various sectors, value chain elements, development phases, themes, approaches of machine learning, logic & rules-based approach, etc. Take advantage of this business process discovery shape to treat your data as a corporate asset and actively look for ways to turn it into a competitive advantage. Incorporate business analytics techniques to analyze data & increase the operational efficiency of your business unit with this business intelligence (BI) layout.
People who downloaded this PowerPoint presentation also viewed the following :
Business analytics evolution chart example of ppt with all 5 slides:
Give due consideration to every contingency with our Business Analytics Evolution Chart Example Of Ppt. Be comprehensive in your approach.


FAQs for Business analytics evolution chart
So it basically started with simple reporting back in the 60s, nothing fancy. Data warehousing hit in the 80s-90s and completely changed how we stored historical stuff. Business intelligence dashboards came next in the 2000s - finally regular people could mess around with data without needing a computer science degree. Around 2010 is when things got wild with big data and machine learning for predictions. Now we're at the point where analytics can actually suggest what to do and run stuff on autopilot, which is pretty nuts if you think about it. Use these phases to figure out where your company sits and what's next.
Dude, the change has been crazy! We went from basic Excel number-crunching to having these real-time insight machines. Cloud computing means you can crunch massive datasets without dropping cash on expensive hardware. AI spots patterns you'd never catch on your own. Visualization tools actually make complex data digestible for everyone - even the executives who hate numbers lol. What's cool is you don't need a computer science degree anymore to pull meaningful insights. Everything's way more user-friendly now. Definitely check out some cloud-based platforms if you haven't yet. The learning curve isn't nearly as brutal as you'd think.
Think of big data as your analytics superpower. You're not guessing anymore or working with tiny samples - you've got massive amounts of info from everywhere flowing in real-time. Honestly, the patterns you can spot are crazy impressive. Customer behavior, market trends, predictions about what's coming next - it's all there if you know how to dig through it. The tricky part? You need solid tools to make sense of all that chaos. Otherwise you're just drowning in numbers. But when you nail it, that raw data becomes the strategy that actually moves your business forward.
Dude, AI and ML completely flipped business analytics on its head. You're not just seeing what already happened anymore - now you can actually predict future trends and get solid recommendations. Honestly, it's kind of crazy how these tools went from being glorified spreadsheets to having real smarts. Those complex patterns that used to take your team weeks to find? ML spots them in minutes, plus catches stuff you'd totally miss. I'd mess around with some basic predictive models in whatever dashboard you're using now. Even the simple ones will surprise you.
So regular reporting is backwards-looking, right? Like it shows you last quarter's sales or whatever already happened. Predictive stuff flips that - it uses your data patterns to predict what's coming next. Pretty cool actually. Instead of finding out churn went up 15% after the fact, you'd know which customers are about to bail in the next month. Then you can actually do something about it before they're gone. Way better than scrambling to fix problems that already happened. The accuracy gets scary good once you have enough history to work with.
Okay so basically you want to focus on consent, transparency, and only grabbing data you actually need. Your customers should know what you're collecting - like, really know, not buried in some 50-page terms thing nobody reads. Don't hoard data just because you can, that's how companies get into trouble. Cambridge Analytica was such a mess and shows what happens when this goes wrong. Also make sure you can't piece together who people are from your analytics. Honestly, just think "would I want someone doing this with my info?" That gut check works pretty well.
Yeah, totally doable! Google Analytics and social media insights are free - start there. Big companies actually suck at this because they take forever to make decisions while you can pivot instantly. Pick one metric that actually matters to your business (conversion rate, customer lifetime value, whatever) and just obsess over it. Honestly, most corporations are terrible at using their own data anyway. Your whole advantage is being fast and knowing your customers personally, so use analytics to figure out what's already clicking and do more of that stuff.
Honestly, focus on getting really good at one programming language instead of being okay at like three - I'd go with Python or R. SQL is non-negotiable though, you'll use it constantly. For viz tools, Tableau and Power BI are solid choices. The thing people don't realize is communication skills matter just as much as the technical stuff. You're always explaining data insights to people who don't speak analytics. Critical thinking and understanding the business side help too. My advice? Start with whatever technical skill you're already using most, then work on getting better at storytelling with your data.
Dude, data democratization has totally changed how decisions get made. Teams don't have to wait around for IT anymore - they just jump into dashboards and pull their own reports. Super fast compared to before. But honestly? It's kind of a mess sometimes because marketing will look at the same data as sales and come up with completely different takeaways. You'll have departments arguing over what the numbers actually mean. The trick is getting everyone trained on basic data stuff first - otherwise people just wave around charts without really understanding what they're looking at. Makes a huge difference though.
Dude, Netflix is the obvious one - went from mailing DVDs to basically owning streaming by figuring out what you'd binge next. Amazon's scary good at this too, their "you might like" thing drives 35% of sales (wild, right?). Oh, and Target got creepy-accurate at predicting pregnancies before women even told family. Walmart's doing it with inventory and prices across thousands of locations. The thing is, these companies don't just hoard data like digital pack rats - they actually use it to completely change how they run things. That's what separates the winners from everyone else collecting pointless spreadsheets.
Build validation rules right into your pipeline - don't wait to clean up the mess later. Someone actually has to own this process or it'll just fall through the cracks (learned that one the hard way). Set up automated checks that flag weird data as it comes in. Regular audits help too. When your analysts find something funky, make sure that feedback gets back to whoever's feeding the system. Honestly, the biggest thing is getting everyone to care about data quality, not just dumping it on IT. Oh, and governance sounds boring but you really need clear rules about who does what.
So the big stuff to watch: AI that predicts trends, real-time data processing, and those self-service tools that let marketing run their own reports. Edge computing's taking off too - processing data closer to where it's created instead of shipping everything to the cloud first. But honestly? The democratization thing is what's really changing the game. Your marketing team won't need to constantly bug IT for customer breakdowns anymore. Oh, and quick win for you - figure out which manual reports you're still doing that could just be automated. That's like... the easiest place to start.
Honestly, visualization tools are game-changers for presentations. They turn those soul-crushing spreadsheets into something people actually remember. Bar charts and line graphs help you spot trends and weird outliers super fast - way better than making everyone squint at endless rows of numbers. Nobody's got time for that. Start simple though, don't go crazy with fancy stuff right away. I learned this the hard way when I made some overly complex dashboard that confused everyone. Clear beats clever when you're trying to get buy-in. Your recommendations will hit so much harder when people can see the story in the data.
Honestly, the worst part is usually your data being a complete mess - scattered everywhere, half-missing, you know the drill. Teams also hate change, so good luck getting buy-in there. Oh, and don't even get me started on leadership wanting miracles by next Tuesday. You'll need someone who can actually make sense of the numbers, not just create fancy charts that look impressive but mean nothing. Skills gap is real. My take? Pick one small thing to focus on first. Clean your data before you do anything else (seriously, this will save your sanity). Make sure someone can turn insights into actual decisions.
Dude, cross-departmental collaboration is huge for analytics - like, night and day difference. Each team brings their own data and viewpoint. Sales knows why customers act weird, marketing gets the campaign timing, operations has supply chain stuff. When they work together instead of staying in silos, you catch insights nobody would've spotted alone. My old company was terrible at this initially, but once we got everyone talking? Total game changer. I'd say pick one business problem that affects multiple departments and get reps from each team to solve it together. You'll be surprised what comes up.
-
Very well designed and informative templates.
-
Colors used are bright and distinctive.