

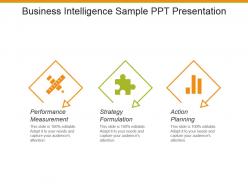
Business intelligence sample ppt presentation


Try Before you Buy Download Free Sample Product
 Impress Your
 Audience
Editable
of Time


Achieve the correct ambiance with our Business Intelligence Sample Ppt Presentation. Create the exact atmosphere you desire.
People who downloaded this PowerPoint presentation also viewed the following :
Business intelligence sample ppt presentation with all 5 slides:
Demonstrate how computers are a boon with our Business Intelligence Sample Ppt Presentation. It will improve digital awareness.


FAQs for Business intelligence
Honestly, start with getting your data cleaned up first - garbage in, garbage out, you know? Pick tools your team can actually figure out because I've seen too many companies blow money on dashboards that just sit there collecting dust. Get the executives on board early or you'll be fighting uphill battles later. Focus on answering real business questions instead of hoarding random metrics. Security stuff matters too, obviously. My advice? Test it with one department first, show some wins, then expand from there. Oh, and make sure your KPIs actually connect to what the business cares about.
Honestly, data analytics is a game changer for spotting patterns you'd never catch just eyeballing things. Your sales trends, how customers actually behave, operational stuff - it's all there in the numbers you're probably already collecting anyway. Gut decisions are fine sometimes, but why guess when you can know what's working? The trick is building dashboards for your key metrics (customer acquisition costs, monthly recurring revenue, whatever matters most) and then - this is crucial - actually checking them regularly. I've seen so many people create beautiful charts that just sit there collecting digital dust. Start with one area first though, don't try to track everything at once.
Honestly, data visualization is a game changer - it takes those messy spreadsheets and turns them into something you can actually understand. Charts and dashboards help you spot trends instantly instead of squinting at endless rows of numbers. Think phone book vs. map, you know? Both have the info, but only one makes sense quickly. Heat maps are great for starting out, then move to bar charts. The visual stuff helps you explain findings to people who zone out at spreadsheets (which is most people, let's be real). You'll make decisions way faster once patterns jump out at you.
Honestly, real-time data is a game changer for BI. Instead of finding out about problems weeks later, you'll catch trends and issues as they're happening. Website crashes, supply chain problems, sudden sales jumps - you can actually do something about them while it matters. Way better than staring at last month's reports wondering what went wrong. Just don't go crazy trying to monitor everything in real-time right away (your budget will hate you). Pick one critical metric first and see how it goes. Oh, and make sure your systems can handle the constant data flow without melting down.
Honestly? Your biggest pain points are gonna be messy data and getting people to actually give a damn about using the system. Most companies have data spread across like five different platforms, half of it's wrong or outdated. Makes everything you build kinda useless from the start. People hate changing how they work too - even if your new dashboard is amazing, they'll stick with their ancient Excel sheets because that's what they know. Integration headaches are real, and don't get me started on performance issues when you're pulling from multiple sources. My advice? Pick one team first and obsess over cleaning their data before you do anything fancy.
Honestly, you don't need to blow your budget on this stuff anymore. Cloud-based BI tools are way more affordable than they used to be - which is lucky because who has money for expensive software these days? Start with just one thing, like tracking your sales or maybe inventory. Don't try to analyze everything right away, you'll go crazy. Basic dashboards showing your key numbers work great for beginners. The real game-changer is finally having solid data instead of just winging it with gut feelings. You can spot trends, see what's actually profitable, track how customers behave. Build it up slowly from there.
Track both the tech stuff and business impact. Data quality scores and system uptime are obvious ones - plus how many people actually use it (empty dashboards are depressing). Business-wise, look at how fast teams make decisions now versus before, any cost savings, and basic ROI. User satisfaction surveys matter way more than you'd think. People will straight-up tell you if your BI setup sucks or rocks. Don't go crazy though - pick 3-5 metrics that match what you originally wanted to achieve.
So ML basically automates all that pattern-finding stuff you'd miss otherwise. You're not just stuck looking at last quarter's numbers - now you can actually predict what's coming and catch weird anomalies as they happen. The cool part? It handles those huge datasets that would take you forever to dig through manually. I mean, think of it like having a data person who works 24/7. Your insights keep getting better too since it learns from fresh data constantly. Honestly, just try it with something simple like sales forecasting first. You'll see what I mean.
So cloud BI basically means all your analytics stuff runs online - you just log in from wherever. Traditional BI? You're stuck maintaining your own servers and all that tech mess. Honestly such a pain. Cloud scales better since you're not buying more hardware every time you grow. Plus way cheaper upfront costs. Your team can access everything remotely too, which is huge these days. I'd think about how often people need data on the go and whether your IT folks can actually handle running servers themselves.
Look, start with the basics - consent, transparency, and only grabbing data you actually need. Don't collect stuff just because you can, that's how companies get themselves in trouble. Be totally upfront about what you're doing with people's info, no shady business. Security is obviously huge too. Oh and watch out for biased data sources - they'll mess up your decisions down the line. Honestly, I'd begin by checking what you're already doing wrong and writing down some real policies. Most companies think they're being ethical but haven't actually looked at their practices in years.
BI basically pulls all your customer data together - sales, support, web stuff, social media, whatever you've got. You'll see exactly where people are dropping off and which groups need different treatment. Real-time satisfaction tracking is pretty sweet too. Honestly, the whole picture just makes way more sense than trying to guess what's happening. Plus you can actually predict what customers might do next instead of just winging it. Oh, and personalizing becomes so much easier when you have real data backing your decisions. I'd start by just listing out where you're already collecting customer info.
Honestly, AI and machine learning are total game-changers right now. They're finding insights that used to take us hours to dig up manually. Cloud platforms have made everything way more accessible too - no more waiting around for IT to set stuff up. Real-time analytics is pretty much standard now, which is amazing because those overnight reports were brutal. Plus you can literally ask your data questions in plain English now with natural language processing. Self-service tools are spreading to other departments too, which is cool but also means more random questions for us lol. I'd definitely start small with some AI features in whatever you're already using.
Data governance is huge for BI - like, you can't skip it. Your dashboards become useless if the data's garbage or inconsistent. I've seen teams argue over completely different numbers for the same metric because nobody agreed on definitions upfront. Pain in the ass, honestly. Good governance means everyone uses the same data definitions and someone actually owns each dataset. Quality standards matter too. Start simple though - just document your main data sources first, then get people to agree on how you're measuring your top metrics. Build from there.
Honestly, start with automated checks at the source - catch duplicates and missing data before it even hits your dashboards. Someone needs to own each dataset too, otherwise nobody's accountable when things go sideways. Regular audits are clutch, plus get your business users to flag when numbers seem weird (they're usually right). Document where your data comes from so you can actually trace problems back. Oh, and set up monitoring - I learned this the hard way but fixing messy data after the fact is absolutely brutal.
Oh man, BI tools will save your sanity on compliance stuff. Set up dashboards that track your regulatory metrics automatically - no more manual spreadsheet hell. They'll flag issues before they become real problems, which honestly beats scrambling during audit season. The historical data thing is clutch too since you can pull compliance patterns going back months or years in seconds. Auto-generated reports are a game changer when regulators come knocking. My advice? Pick your biggest compliance headaches first and build dashboards around those. You'll wonder how you survived without them.
-
Awesome presentation, really professional and easy to edit.
-
Unique design & color.