


Big Data Ppt Powerpoint Presentation Slides





Try Before you Buy Download Free Sample Product
 Impress Your
 Audience
 100%
100% Editable
 Save Hours
 of Time


Big data has brought about a revolution in the field of information technology. Our content-ready big data PPT PowerPoint presentation slides shed light on the importance and relevance of large volumes of data. The data management presentation covers myriad of topics such as big data sources, market forecast, 3 Vs, technologies, workflow, data analytics process, impact, benefit, future, opportunity and challenges, and many additional slides containing graphs and charts. The biggest benefit that this big data analytics presentation template offers is that it enables you to unearth the information that can be used to shape the future of your business. Moreover, these designs can also be utilized to craft your own presentation on predictive analytics, data processing application, database, cloud computing, business intelligence, and user behavior analytics. Moreover, you can also download our big data analytics ppt which will help you make accurate business decisions. Enlighten folks on fraud with our Big Data Ppt Powerpoint Presentation Slides. Convince them to be highly alert.
People who downloaded this PowerPoint presentation also viewed the following :
Content of this Powerpoint Presentation
Slide 1: This slide introduces Big Data PPT- What is BIG DATA. State Your Company Name and get started.
Slide 2: This is an Agenda slide. State your agendas here.
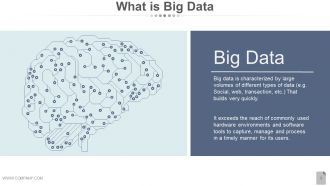
Slide 3: This slide presents What is Big Data with its definition.
Slide 4: This slide presents Big Data Facts- How Big is Big Data in tabled list form.
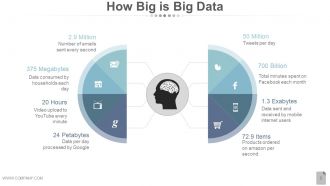
Slide 5: This slide also presents How Big is Big Data with examples such as- Products ordered per second, Data sent and received by mobile internet users, Tweets per day, Total minutes spent on facebook each month, Number Of Emails Sent Every Second, Data consumed by households each day, Data per day processed by google, Video upload to youtube every minute.
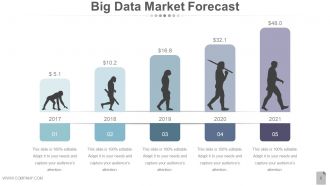
Slide 6: This slide presents Big Data Market Forecast for a particular duration (years/months) to be assessed.
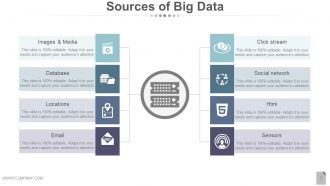
Slide 7: This slide presents Sources of Big Data with the following points- Images & Media, Sensors, Click Stream, Social Network, Html, Email, Locations, Database.
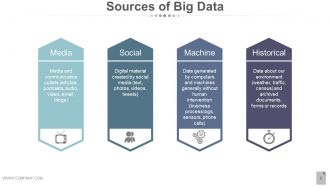
Slide 8: This slide also showcases Sources of Big Data with the following points- Media: Media and communication outlets (articles, podcasts, audio, video, email, blogs) Social: Digital material created by social media (text, photos, videos, tweets) Machine: Data generated by computers and machines generally without human intervention (business process logs, sensors, phone calls) Historical: Data about our environment (weather, traffic, census) and archived documents, forms or records
Slide 9: This slide shows 3 Vs of Big Data- Volume: Terabytes, Records, Transactions, Tables, files. Variety: Batch, Near Time, Semistructured, Streams. Velocity: Structured, Unstructured, Semistructured.
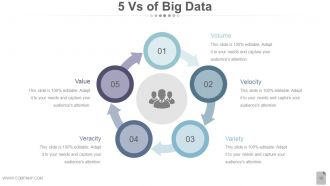
Slide 10: This slide presents 5 Vs of Big Data. They are- Volume, Velocity, Variety, Veracity, Value.
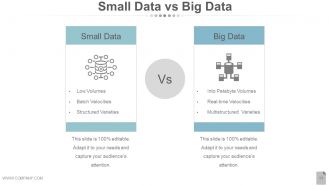
Slide 11: This slide presents Small Data Vs Big Data. SMALL DATA (Low volumes, Batch velocities, Structured varieties) BIG DATA (Into petabyte volumes, Real-time velocities, Multistructured varieties).
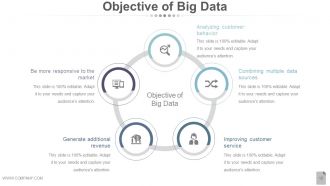
Slide 12: This slide presents Objective of Big Data such as- Analyzing customer behavior, Combining multiple data sources, Improving customer service, Generate additional revenue, Be more responsive to the market.
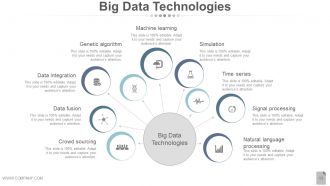
Slide 13: This slide presents Big Data Technologies with the following points- Big Data Technologies, Crowd sourcing, Data fusion, Data integration, Machine learning, Simulation, Genetic algorithm, Natural language processing, Signal processing, Time series.
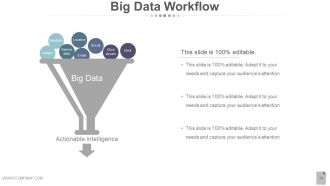
Slide 14: This slide showcases Big Data Workflow with the following content- Big Data, Email, Click Stream, Html, Social, Location, Database, Sensor Data, Images, Actionable intelligence.
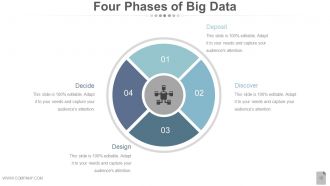
Slide 15: This slide presents Four Phases of Big Data. The listed ones are- Deposit, Discover, Design, Decide.
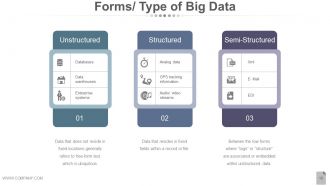
Slide 16: This slide shows Forms/Type of Big Data in- Unstructured: Data that does not reside in fixed locations generally refers to free-form text, which is ubiquitous. Structured: Data that resides in fixed fields within a record or file. Semi-Structured: Between the tow forms where “tags” or “structure” are associated or embedded within unstructured data.
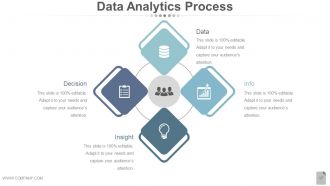
Slide 17: This slide presents Data Analytics Process with the following subheadings- Decision, Data, Insight, Info.
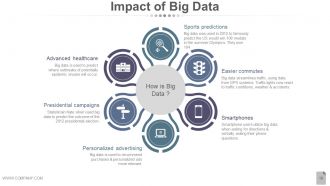
Slide 18: This slide presents Impact of Big Data with the following points- How Is Big Data? Sports predictions, Easier commutes, Smartphones, Personalized advertising, Presidential campaigns, Advanced healthcare.
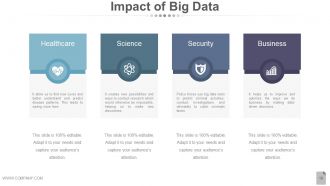
Slide 19: This slide presents Impact of Big Data in the following sectors- Healthcare, Science, Security, Business.
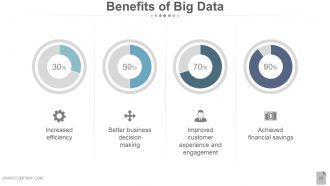
Slide 20: This slide showcases Benefits of Big Data such as- Better business decision making, Improved customer experience and engagement, Achieved financial savings, Increased efficiency.
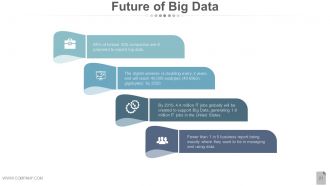
Slide 21: This slide states Future of Big Data to be shown.
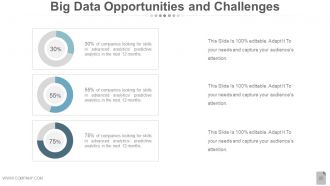
Slide 22: This slide presents Big Data Opportunities and Challenges. State them here.
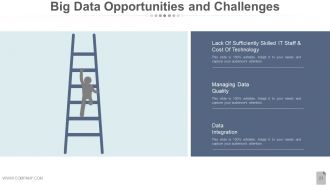
Slide 23: This slide presents Big Data Opportunities and Challenges such as- Lack of sufficiently skilled IT staff & cost of technology, Managing data quality, Data integration.
Slide 24: This slide is titled Additional Slides to move forward. You can change/alter the slide content as per need.
Slide 25: This is Our Mission slide. State company mission here.
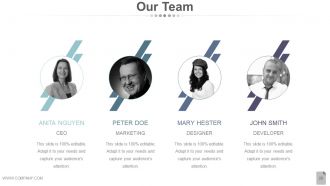
Slide 26: This is Our Team slide with name, designation and image boxes.
Slide 27: This is an About Us slide. State team/company specifications here.
Slide 28: This Our Goal slide. State goals etc. here.
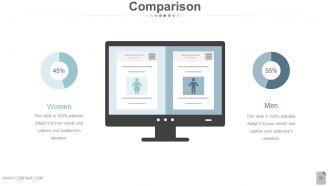
Slide 29: This is a Comparison slide for comparing entities/products etc. here.
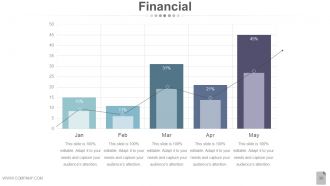
Slide 30: This is a Financial score slide. State financial aspects etc. here.
Slide 31: This is a Quotes slide to convey company messages, beliefs etc. You can change the slide contents as per need.
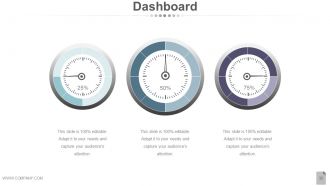
Slide 32: This is a Dashboard slide to state metrics, kpis etc.
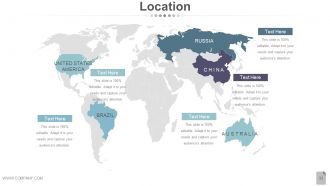
Slide 33: This is a Location slide of world map image to show global presence, growth etc.
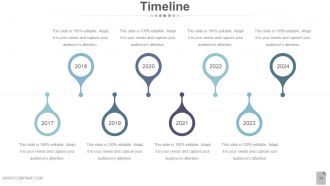
Slide 34: This is a Timeline slide to show evolution, growth, milestones etc.
Slide 35: This is a Post It slide to mark events, important information etc.
Slide 36: This is a Newspaper slide to show news, events etc. You can change the slide contents as per need.
Slide 37: This is a Puzzle image slide to show information, specifications etc.
Slide 38: This is a Target image slide. State targets, etc. here.
Slide 39: This is a Circular image slide to show information, specifications etc.
Slide 40: This is a Venn diagram image slide to show information, specifications etc.
Slide 41: This is a Mind map image slide to show information, specifications etc.
Slide 42: This is a Matrix slide to show information, specifications etc.
Slide 43: This is a Lego image slide to show information, specifications etc.
Slide 44: This is a Silhouettes image slide to show information, specifications etc.
Slide 45: This is a Hierarchy image slide to show information, specifications etc.
Slide 46: This is a Bulb/Idea image slide to show information, specifications, innovative aspects etc.
Slide 47: This is a Magnifying glass image slide to show information, specifications etc.
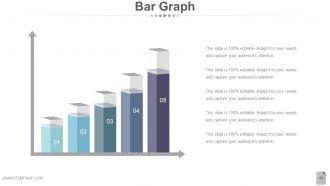
Slide 48: This is a Bar Graph image slide to show product/entity comparison, information etc.
Slide 49: This is a Funnel image slide to show information, specifications etc.
Slide 50: This is a Thank You slide with Address# street number, city, state, Contact Numbers, Email Address.
Big Data Ppt Powerpoint Presentation Slides with all 50 slides:
Cut down the journalese with our Big Data Ppt Powerpoint Presentation Slides. Ensure the issue becomes easy to figure out.







FAQs for Big Data Ppt
So basically you've got your data ingestion stuff like Kafka, storage (Hadoop HDFS or whatever cloud thing you're using), and processing engines like Spark. Then there's the analytics and visualization layers on top. Honestly, security and data governance are super boring but you can't skip them - learned that the hard way. Orchestration tools like Airflow keep your pipelines from breaking constantly. My advice? Map out what data you actually need flowing where first. Don't try building everything at once or you'll go crazy. Pick components that make sense for your specific situation.
So basically you need automated pipelines checking for duplicates and missing data as it comes in. Data profiling tools are a must - there's no way you're manually checking Big Data volumes, that's just insane. Most companies track data lineage so they can figure out where stuff went wrong. Oh and schema validation is huge too, keeps everything standardized. The trick is baking quality checks right into your ingestion process instead of scrambling later. Honestly, start with monitoring dashboards first. Your team will thank you when they catch issues before they spiral.
Honestly, ML is like having a really smart intern who never gets tired. You feed it your data and it starts finding patterns you'd never catch manually - or would take you months to spot. It predicts what customers will do, catches fraud, suggests products, all that good stuff. The best part? It actually gets smarter over time without you babysitting it. I'd say pick one problem first and see how it performs. Don't try to boil the ocean right away. Trust me, once you see it work on something small, you'll be hooked on scaling it up.
Big Data lets you slice up customers way better than just looking at age and gender stuff. You're digging into purchase history, what they click on, social media habits - all that good data. Machine learning can find weird segments you'd never guess, like "people who shop Sunday mornings after scrolling Instagram for 20 minutes" (I swear these algorithms are getting creepy good). Mix your sales data with how people actually behave across your website, emails, whatever. Honestly? Start with your biggest money-makers first. Figure out what makes those customers tick, then build campaigns around that.
Honestly, data quality problems will drive you crazy - that's the big one. Storage costs add up fast too if you're not careful. Good luck finding engineers who actually get this stuff, they're expensive and hard to find. Your current systems probably can't handle the data volume anyway, so integration becomes this whole mess. Security and compliance requirements are brutal depending on your industry (banking is the worst). Performance issues always hit at 3am when everything's processing. Start with something small first, get your data governance sorted early, and seriously budget like double what you think for engineering talent. Trust me on that last part.
So data lakes are basically like throwing everything into one giant messy pile - videos, spreadsheets, random sensor stuff, you name it. No organization needed upfront. Warehouses? Total opposite. You've gotta clean and structure everything before it goes in, like a super organized filing system. Here's the thing though - lakes let you dump anything but they're slower when you actually want to find something specific. Warehouses are crazy fast for queries but way less flexible. Honestly depends what you're prioritizing - do you want the flexibility to store weird data types, or do you need lightning-fast searches?
Okay so basically three big things you gotta watch out for: privacy, consent, and bias. Get proper consent before grabbing anyone's personal data - be upfront about what you're doing with it. Privacy-wise, anonymize whatever you can and don't hoard unnecessary stuff. The bias thing is honestly where most people screw up, even experienced folks. Your models will just repeat whatever discrimination exists in your training data if it's not representative enough. Always check your datasets for fairness across different groups. Oh, and definitely do a privacy impact assessment on your current projects first - you'll catch problems early instead of dealing with disasters later.
So predictive analytics is like having a crystal ball for your business data. It digs through all your historical info to spot patterns and predict what's coming next. Pretty cool stuff, honestly. Instead of just reacting to things after they happen, you can actually see which customers might bail, when sales will jump, or if your equipment's about to crap out. The algorithms catch trends you'd never notice buried in all that data. My advice? Don't go crazy trying to predict everything at once. Pick one specific problem you're dealing with and test it out there first.
Honestly, Spark's probably your go-to for big data stuff - handles both batch and streaming pretty smoothly. Hadoop still works but feels kinda outdated now. If you don't want the headache of managing servers, just go with cloud options like AWS EMR or BigQuery. Way less painful. Python with pandas is solid for smaller datasets, though I guess that's obvious. Databricks is nice if you need that collaborative workspace thing. Oh, and definitely figure out what you actually need first - I've seen people overcomplicate this so much. Start simple, then scale up if needed.
Honestly, big data is pretty clutch for supply chains. You get real-time views of your inventory, demand patterns, supplier performance - all that stuff. The predictive side is where it gets really interesting though. Instead of scrambling when you run out of stock, you can see it coming weeks ahead. Same with demand spikes from weather changes or whatever's trending. Route optimization saves you tons on shipping too. Oh, and you'll spot quality issues way earlier by watching supplier data trends. My advice? Don't go crazy trying to fix everything at once. Pick one headache - maybe inventory forecasting - and nail that first.
Honestly, visualization is a game changer when you're drowning in data. Your brain processes visual patterns way faster than scanning through spreadsheets - like, we're just wired that way. Heat maps are perfect for geographic stuff, while time series charts show trends over time. The trick is matching the right chart type to what story you're trying to tell. I used to just stare at numbers until my eyes crossed, but now? A good graph shows me outliers and relationships instantly. Way less painful than scrolling through endless rows of data.
Honestly, big data changes everything about making decisions. Instead of just going with your gut, you're working with actual evidence. The pattern recognition stuff is crazy - you can predict trends and really get inside your customers' heads. Marketing campaigns become way more targeted, and you're not wasting resources on random guesses anymore. Though I gotta say, you need someone who can actually read all those numbers, or you'll just end up more confused than when you started. It's like having superpowers, but only if you know how to use them.
Honestly, the whole compliance thing is such a headache but here's what works. Build privacy stuff into your system from the start - way easier than retrofitting later. Map out what data you're actually collecting first because you can't protect mystery data. Set up governance frameworks to classify sensitive info and control who sees what. GDPR and CCPA keep changing the rules which is super annoying. Automate compliance checks when you can, train your team regularly, and definitely loop in legal early. Oh, and keep audit trails for everything - regulators love their paper trails.
AI analytics and real-time processing are totally worth watching - they're changing everything right now. Edge computing is huge too since it processes data way closer to the source, so everything runs faster. The automation stuff honestly gets me most excited because who wants to do manual work all day? Privacy tools and data democratization are trending hard, which is great for getting non-tech people actually using insights. Oh, and definitely audit what you've got first - see where these fit in. That's probably the smartest starting point anyway.
Honestly? Just grab Google Analytics and mess around with Apache Spark first - no need to blow your budget on fancy enterprise stuff. Collect data you'll actually use, not every single thing you can track. AWS and Google Cloud are great since you only pay for what you need. Most startups I know collect tons of data then never look at it again lol. If you can't afford a data scientist yet, try partnering with local universities or check out Kaggle for talent. The whole trick is proving this stuff works before you go crazy with expensive infrastructure. Start small, see results, then scale up.
-
Good
-
Nice
-
Excellent design and quick turnaround.
-
Topic best represented with attractive design.