



 0 Comment
 Customer Reviews

In the world of SaaS, data is everything. Raw numbers, however, don’t drive businesses to decisions; insights do. That’s why we’ve crafted these SaaS Sales Dashboard Templates. This visually appealing and content-ready template deck simplifies complicated metrics and makes smarter sales decisions. Whether you’re a startup entrepreneur or an expert sales ops leader, these slides will give you the clarity to track and scale effectively.
From monthly recurring revenue (MRR) dashboards, trial-to-paid conversion trackers, and customer acquisition dashboards to sales forecasting panels and lifetime value (LTV) metrics, this bundle offers everything you need to present your SaaS sales performance in a precise, actionable way.
Monitor churn rate, net revenue retention (NRR) tracker, account-based sales tracker, and usage-based billing metrics with intuitive graphics and layouts. Each slide is fully customizable, easy to edit, and developed with amazing visuals that make data storytelling smooth. These templates facilitate your sales and revenue teams.
Strengthen your business insights with these Top 7 Sales Report Dashboard Templates and equip your teams to identify the crucial role of sales reports to achieve great numbers.
Template 1: SaaS Sales Dashboard for Analyzing Business Growth
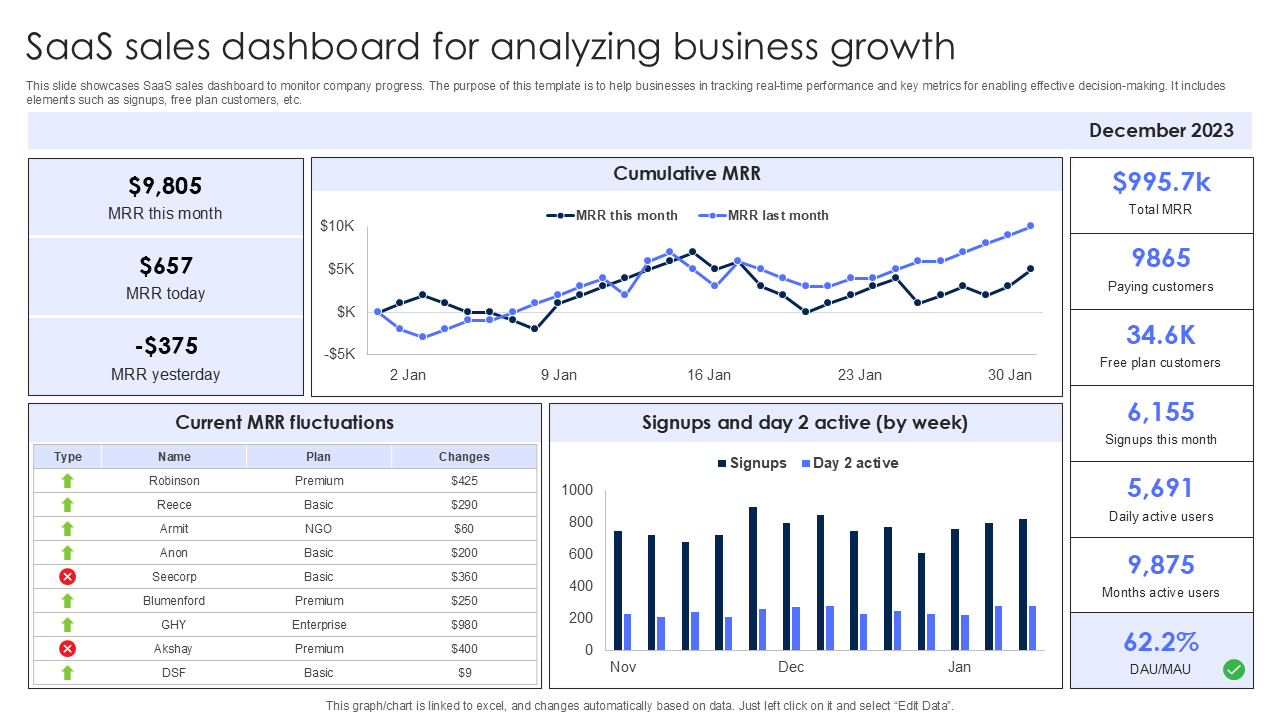
Decisions without data usually end up being wrong. But with this PPT template, you can stay updated with your company's progress and track real-time lead conversion metrics to make data-driven decisions. Record and assess metrics like MRR for the current month, current day, and the previous day with a graphical edge computing cumulative MRR for current and previous month dates. The slide also offers space for recording MMR fluctuations with customers' names, plans, and changes, along with monthly data of signups and Day 2 active audiences' numbers. Download this slide and conclude the data of a particular month depicting its total MRR, paying customers, free plan customers, signups, daily active users, monthly active users, and DAU/MAU.
Template 2: SaaS Sales Pipeline Dashboard For Businesses
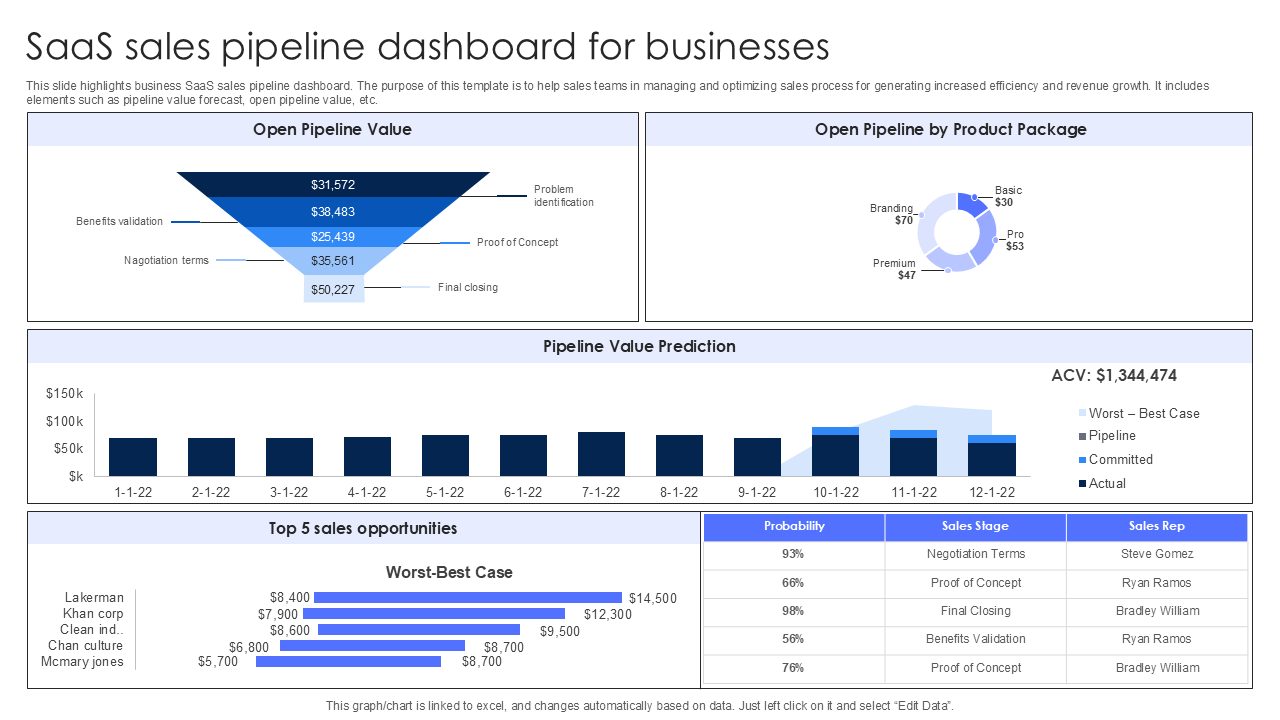
Organize and optimize your team's sales process with this SaaS sales pipeline overview dashboard PPT Template. It depicts elements, such as open pipeline value for your business, wherein you can record and present factors on benefits validation, final closing, proof of concept, problem identification, and negotiation terms, along with their statistics. Exhibit open pipeline by product package with numbers from parameters, such as branding, basic, pro, and premium, along with pipeline value prediction for dates and statistics in appealing graphics. Sections like the top five sales opportunities with the worst-best case and their numbers can also be presented. The all-in-one dashboard comprises a section to exhibit the probabilities, sales stages, and sales representatives assisting businesses to achieve the highest level of efficiency, leading to growth in revenue. Get it now!
Template 3: KPI Metrics Dashboard To Measure Sales Performance Of SAAS Company
Are you a SaaS company looking for an effective tool or dashboard wherein you can analyze KPI metrics and measure sales performance? You have landed on a perfect SaaS KPI Template! This strategized slide helps your company record, assess, and present KPIs, such as total sales, average sales, count of sales, average impressions, average CTR, and average advertising cost of sale. The slide is equipped with visually-backed graphs, charts, and images to measure monthly organic, referrals, and direct impressions breakdown, product-led sales metrics, state-wise sales count, and monthly dollar sales, along with failed targets. Its sections present region-wise sales in dollars. Grab this dashboard and monitor your company's complete sales performance in a single screen and make effective decisions.

Template 4: Sales Performance Evaluation KPIs for SaaS Business
This PPT Template helps your SaaS business evaluate its sales performance. Fill in all the essential KPIs, such as customer acquisition cost, cost per acquisition, customer lifetime value, average revenue per user, monthly recurring revenue, annual recurring revenue (ARR) tracker, and churn rate monitor, along with their quarterly sales numbers. You can also conclude your business presentations with key sales insights, such as how much customer acquisition cost decreased and its cause, like increased brand awareness and optimized marketing strategies, or an increase in customer lifetime value and its due cause, like improved customer retention dashboard strategies.

Measure and Scale Smarter with Right Dashboards!
In SaaS, success hinges on your ability to measure what matters and act fast. Our SaaS Dashboard Templates are more than just depictions; they are strategic resources crafted to advance your decision-making, predictions, and reporting. With ready-to-use formats, such as expansion revenue tracker, sales velocity report, new signups monitor, and more, these PPT Templates help teams stay focused on performance and growth.
FAQs on SaaS Dashboard
-
What is a SaaS dashboard?
A SaaS dashboard is an illustrative reporting tool that tracks sales and performance metrics like MRR, churn rate, and customer acquisition. It helps SaaS companies oversee growth, make data-oriented decisions, and optimize performance through real-time insights exhibited in a clear, appealing, and easy-to-understand format.
-
How do I create a SaaS dashboard?
To create a SaaS dashboard, recognize pivotal KPIs such as MRR, LTV, churn, and conversions. Use tools like Excel, Tableau, or pre-designed PowerPoint templates to visualize the data. Ensure it’s clear to read, updated regularly, and personalized to your team’s decision-making and reporting requirements.
-
What is SaaS in sales?
SaaS in sales refers to selling Software-as-a-Service products through subscription-based models. Instead of one-time purchases, customers pay recurring fees. Sales focus on onboarding, retention, upselling, and customer success, often using metrics like MRR, ARR, subscription sales tracker, and churn to measure performance and achieve growth via the SaaS Revenue Dashboard.