





 0 Comment
 Customer Reviews

The plan's already written. Three pages, color-coded phases, a timeline someone spent a weekend on.
Nobody's following it.
That's not cynicism—it's just what happens when a data science learning plan gets built around what sounds thorough instead of what actually moves someone forward. Python, then statistics, then ML, then deep learning, then SQL, then a project. Clean. Logical. And somehow, completely paralyzing.
The problem isn't ambition. Most people who sit down to map out a data science roadmap know what they want. A career shift. A promotion. The ability to finally understand what the data team is talking about. The goal is clear. The path isn't.
And it gets worse when you start researching. Every course outline looks different. Some say start with statistics. Others say Python first. Someone on Reddit swears you need SQL before anything else. The AI learning path one bootcamp sells contradicts the one a YouTube channel gives away free. You spend three hours comparing curricula and end up more confused than when you started.
There's also this: a learning plan that looks impressive isn't the same as one that works. Forty modules. Six phases. A certification at the end. It checks all the boxes. But if week three hits and you're still in probability theory with no idea what a real dataset feels like, the plan isn't serving you—it's just reassuring you.
That's why structured, visual frameworks matter here. Not because data science is simple enough to fit on a slide, but because the act of seeing the whole shape of a learning arc—what comes first, what builds on what, where the checkpoints are—changes how you engage with it. Data science skills development isn't linear, but it needs to look navigable.
SlideTeam's data science learning plan templates exist for exactly this. Pre-designed, content-ready frameworks built around how practitioners actually sequence learning—not how a marketing page wants to present it. Whether you're building a personal study guide, designing a training program for a team, or presenting a curriculum to stakeholders, these slides handle the structure.
What follows are the templates worth knowing about.
Template 1: Data Science Learning Plan PPT Graphics
Structured data science learning starts with a clear visual framework that holds the whole arc together. This PPT template is built for educators and team leads who need to communicate a phased learning plan quickly. It works well for presenting a data science fundamentals curriculum or a self-paced study program to stakeholders. The template is 100% editable and customizable.
[product_image id=1486009]
Template 2: Data Science Strategic Plan PPT Sample
Audience attention drops when visuals don't match the quality of your content. This deck captures attention immediately with a creative, structured layout built for data science strategic planning. The polished aesthetic builds credibility before you say a word. Flexible design elements align effortlessly with your brand identity and presentation goals. Use it for data science career path reviews, training proposals, or curriculum presentations. Transform your data science strategy decks today. Download this dynamic template now and elevate every stakeholder conversation.
[product_image id=1407768]
Template 3: Data Science Quarterly Learning Roadmap
A quarterly view gives learners and managers a clear, time-bound picture of progress. This slide delivers a structured Data Science Quarterly Learning Roadmap that breaks curriculum into manageable phases. The visual layout makes dependencies between topics immediately obvious. Use it to present a data science course outline across four distinct learning periods. It anchors milestone reviews and keeps both learners and program leads aligned. Transform your quarterly planning presentations today. Download this template now and drive consistent, measurable learning outcomes.

Download this PowerPoint Template
Template 4: Action Plan for Developing Data Science Strategy by IT
IT teams rarely get a clean, actionable picture of how a data science program actually gets built. This PPT preset covers the key moves — investing in people, equipping teams with the right tools, and building a supporting infrastructure. It's built for IT leads and program managers who need to present a data science implementation plan to decision-makers. The template is 100% editable and customizable.
[product_image id=1024327]
Template 5: Data Science Five-Year Learning Roadmap
Long-term skill development needs a structure that holds across years, not just weeks. This slide maps a five-year data science learning roadmap with clear phase progression and milestone markers. Each stage builds logically on the last, showing how foundational skills scale toward advanced specialization. It's a strong fit for data science career path planning and mentorship program design. Use it to align learners, managers, and program sponsors on a shared multi-year vision. Transform your long-range learning presentations today. Download this template now and give every stakeholder a plan they can actually follow.

Download this PowerPoint Template
Template 6: 30 60 90 Days Plan for Data Science Implementation PPT
The first ninety days in a data science role determine whether someone contributes fast or spins their wheels. This three-stage layout captures the 30-60-90 day implementation arc with clarity and structure. Each phase is visually distinct, making it easy to communicate what gets done, when, and why. It drives audience engagement across onboarding briefings, training kick-offs, and program reviews. Transform your data science onboarding presentations today. Download this dynamic template now and give new practitioners a running start.

Download this PowerPoint Template
Template 7: Data Science Six-Month Learning Roadmap
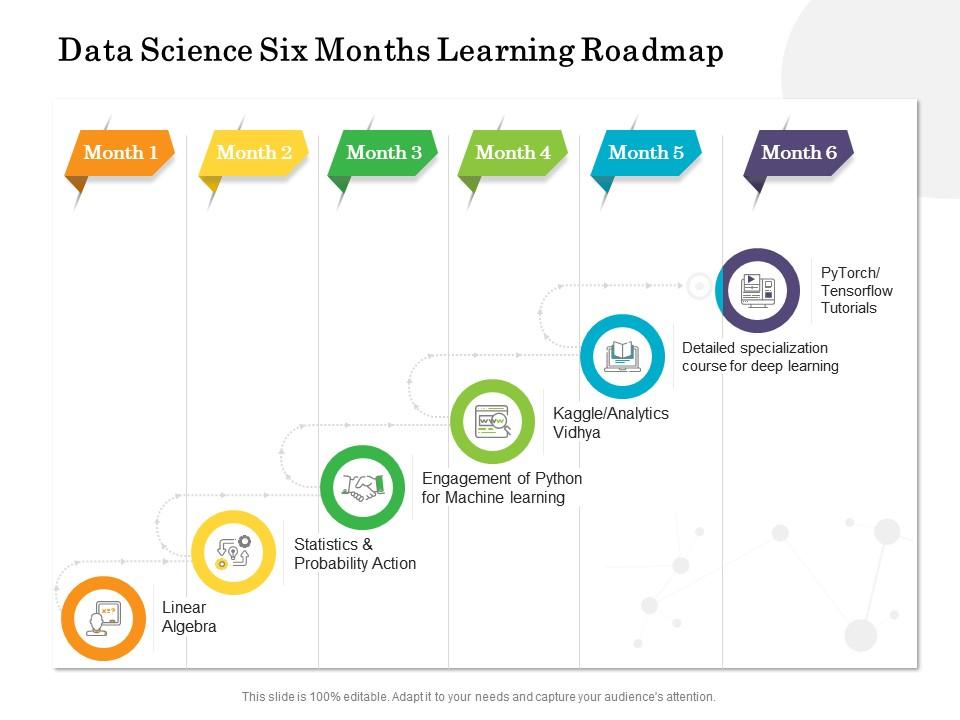
Six months is enough time to move from beginner to capable practitioner—if the plan is built right. This slide lays out a six-month data science learning roadmap with clear phase transitions and skill-building checkpoints. The structured timeline makes it easy to sequence Python, statistics, and modeling topics without overlap or gaps. Use it for self-paced data science learning programs or structured team training curricula. It keeps learners focused and managers informed. Transform your six-month curriculum presentations today. Download this template now and accelerate every learner's path to practical data science proficiency.
Download this PowerPoint Template
Template 8: Information Studies 30 60 90 Days Plan for Data Science Implementation
Knowing what to do in month one versus month three matters more than having a perfect long-term plan. This deck maps a 30-60-90 day data science integration schedule, showing exactly what tasks land at each interval. It's built for program managers and team leads presenting implementation timelines to stakeholders. The three-stage structure covers analysis, implementation, and transformation phases cleanly. The template is 100% editable and customizable.

Download this PowerPoint Template
Template 9: Data Science Technology 30 60 90 Days Plan for Data Science Implementation
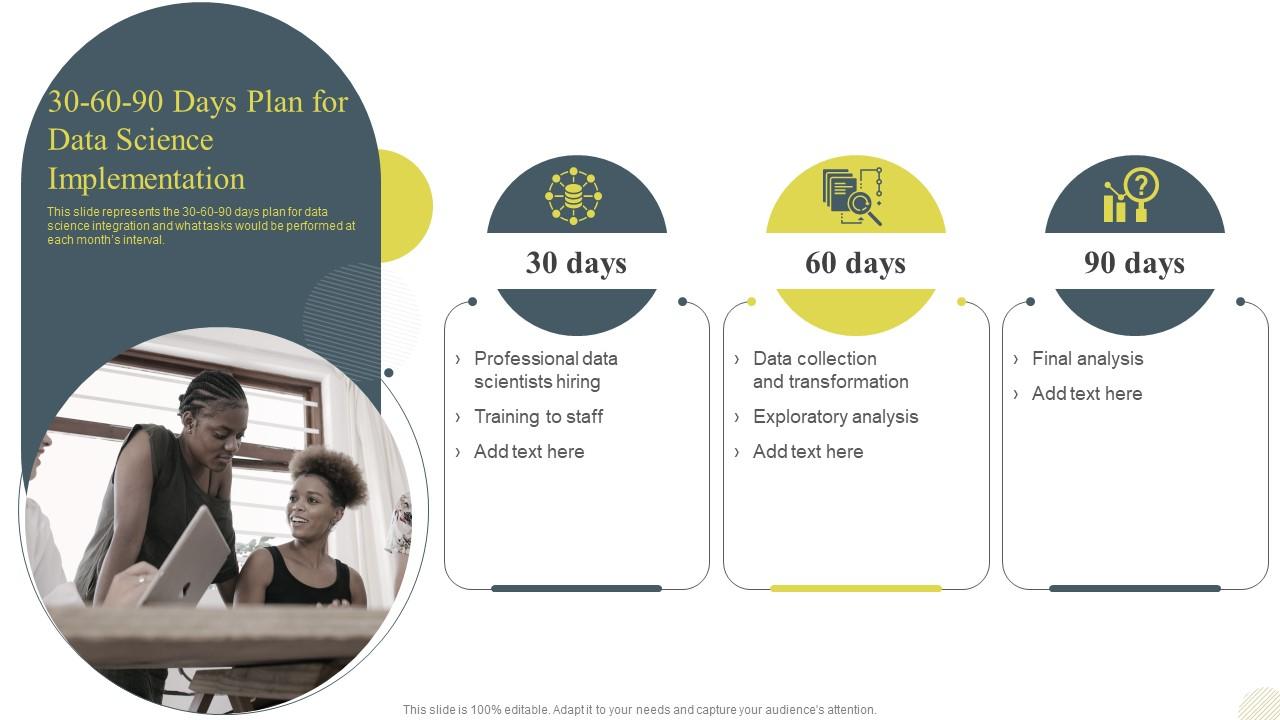
Technology teams need a phased rollout view, not just a list of deliverables. This PPT slide presents a 30-60-90 day data science implementation plan built around implementation, professional development, and transformation stages. It gives IT and analytics leads a concrete structure for presenting progress to leadership. Use it for ML training program kick-offs or data science integration reviews. The template is 100% editable and customizable.
Download this PowerPoint Template
Template 10: Three Sequenced IT stages of 30 60 90 Days for Data Science Implementation
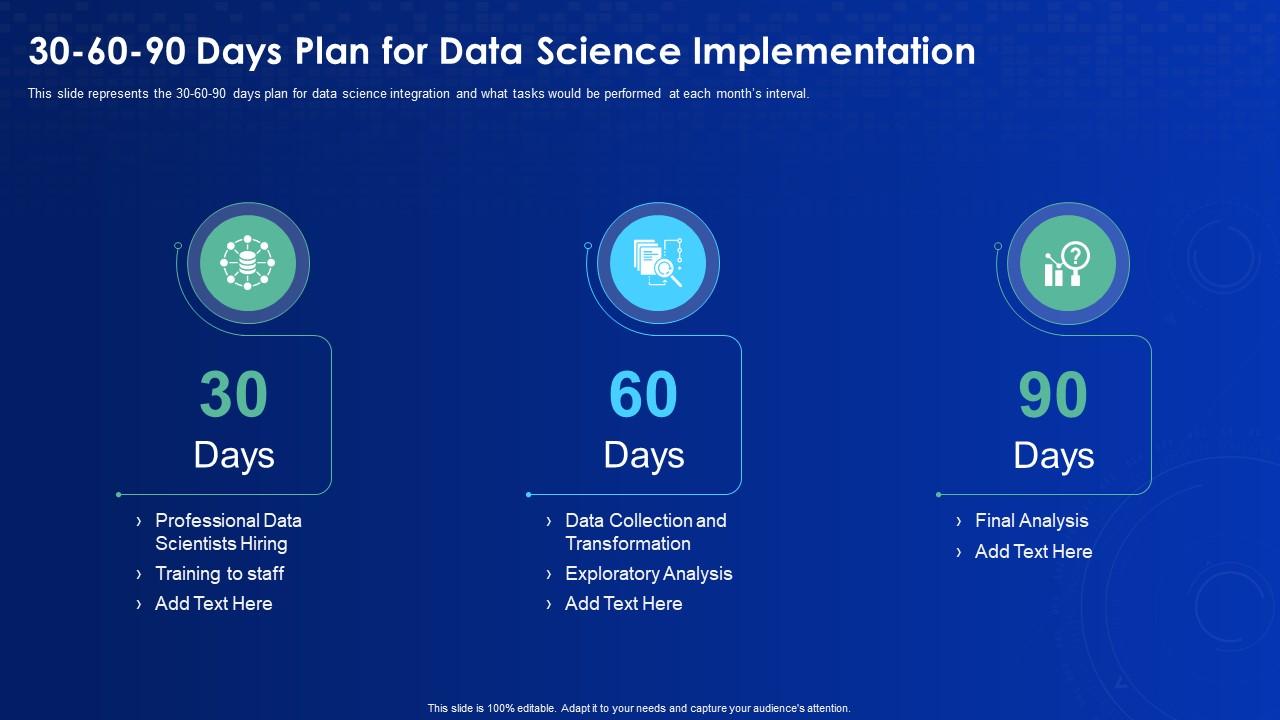
Exploratory analysis, professional data practices, and full implementation — these don't happen all at once. This deck breaks a 30-60-90 day data science plan into three distinct, sequenced stages for IT teams. It helps practitioners and managers communicate what phase they're in and what comes next. Built for data science integration presentations where clarity across intervals is non-negotiable. The template is 100% editable and customizable.
Download this PowerPoint Template
Elevate Your Data Science Learning Plan with SlideTeam
SlideTeam's PowerPoint templates are the best in the industry for building a structured data science learning plan. These content-ready slides save hours of design work while delivering professional clarity across every phase of your curriculum. Whether you're mapping a six-month roadmap, a 30-60-90 day onboarding plan, or a five-year data science career path, these ready-made frameworks keep learners and stakeholders aligned. Grab these templates today and turn your learning vision into a plan people actually follow.
FAQs on Data Science Learning Plan
What are the most critical foundational skills a beginner should prioritize before diving into advanced data science topics?
Start with three things: basic Python programming, descriptive statistics, and working with tabular data using pandas. These cover 80% of real day-to-day data work. Before touching ML models, get comfortable loading, cleaning, and summarizing datasets. Advanced topics like deep learning or model tuning make little sense without this base. Build the foundation first — everything else layers on top.
How should a data science learning plan differ for someone transitioning from a software engineering background versus a non-technical field?
Software engineers already have programming and systems thinking — skip basic Python and jump to data manipulation and ML libraries directly. Non-technical learners need to spend more time on Python fundamentals and statistics before touching modeling. Both groups benefit from project-based work early. The difference is entry point, not destination. Calibrate your starting module to your existing skills, not a generic syllabus.
Which Python libraries should be mastered first, and in what sequence, to build a practical data science workflow?
Start with pandas for data manipulation, then NumPy for numerical operations. Add Matplotlib or Seaborn next for visualization. Once those feel natural, move to Scikit-learn for ML workflows. This sequence mirrors the actual order of tasks in most data projects — load, clean, explore, model. Mastering these four libraries covers the core of a practical data science workflow.
How do you balance learning statistics theory versus applying it directly to real-world datasets in a structured plan?
Learn a statistical concept, then immediately apply it to a real dataset — same week, ideally same session. Don't finish a statistics module before touching data. Concepts like variance or correlation land faster when you compute them on actual numbers. Reserve theory-heavy study for topics like hypothesis testing, where the logic matters before the code. Application should always follow theory within days, not weeks.
What milestones should a data science learner set to measure meaningful progress over a 6-month period?
Month 1: clean and analyze a dataset independently. Month 2: build and evaluate a basic ML model. Month 3: complete one end-to-end project with real data. Month 4: publish that project publicly (GitHub or a blog post). Month 6: apply for a role, internship, or freelance project. These are outcomes, not activity hours — measure what you've shipped, not what you've watched.
How much time should be allocated to data wrangling and cleaning compared to modeling in a self-paced curriculum?
Allocate roughly 60% of early curriculum time to data wrangling and cleaning. Real datasets are messy — missing values, wrong types, duplicates. Most beginners underestimate this and rush to modeling. In practice, clean data produces better models faster than better algorithms on dirty data. As skills mature, this ratio shifts, but early in a self-paced plan, wrangling deserves the larger share.
What role does domain expertise play in shaping a personalized data science learning roadmap?
Domain expertise tells you which questions are worth asking. A data scientist in healthcare needs to understand clinical workflows; one in finance needs to know how risk is measured. Without domain context, even technically correct models solve the wrong problems. Build domain knowledge in parallel with technical skills — read industry reports, talk to practitioners, and choose projects from your target field.
How can a learner effectively structure project-based learning to reinforce theoretical concepts in data science?
Pick one real dataset per concept you're learning. After studying a technique — say, linear regression — immediately apply it to that dataset before moving on. Document what you tried and what failed. Share the project publicly once complete. This forces you to debug real errors, not just follow tutorials. Three or four such projects, done well, demonstrate more than dozens of completed courses.


