





 0 Comment
 Customer Reviews

Are you tracking the right numbers in your project activities?
Well, if not, then an operational excellence/efficiency dashboard can make it happen. It can give you a clear picture of the company, the ongoing projects, and the operational performance metrics. It can help you see what is working and what is not. It shows details using data visualization tools and basically works like a business intelligence dashboard that brings numbers and visuals together.
Also, with solid performance management tools, you can track those numbers and achieve the desired goals for your firm. They are also considered lean management dashboards, which can save you both time and resources. You also get smart insights with a continuous improvement dashboard and make things better every day.
To get the maximum benefit of the approach, you can combine these tools into one strategic business performance dashboard. It can help you and your team to set goals, make strategic plans, and hit targets. In short, that is how operational insights dashboards make your project work smarter with data-driven decision-making every day.
Now, if you want to make the concept more effective, you will need a structured layout to present the KPIs. And that is where our Slidetech templates fit in the picture. Our experts have created some ready-made presentation documents with built-in KPI dashboard formats. They are totally customizable, so you can make changes as per your project requirements.
With these PowerPoint templates, you can simplify complicated data in clean, easy charts and assist your teams in project planning. You can track overall progress through these improvement dashboard designs and fix issues daily. In simple terms, you can use these documents to check performance data, track KPIs, plan lean work, and create progress reports. Plus, these layouts are entirely versatile, so you can add relevant info and tailor them to any industry or department.
Now, let us explore our Top 10 Operational Excellence Dashboard Templates with Samples and Examples.
Template 1: Operations Dashboard Powerpoint PPT Template Bundles
Add this complete template to your deck and illustrate critical aspects of project operations. It includes structured formats for hospital operational metrics, fleet management operations, IT services, sales, marketing, human resource management operations, etc. The template also shows logistics operations, security operations, and important key performance indicator dashboards that improve work and boost results. This PPT template can also include diagrams and charts that help you simplify complicated data and reduce mistakes. Get it from the link below and prepare smart reports for your firm. Feel free to change color, text, icon, and font size as per your need.
[product_image id=694352]
Template 2: Operational Excellence Metrics Powerpoint Presentation Slides
Use this PowerPoint deck to analyze operational data and ensure the functioning of your organization. It includes different operational performance metrics templates to understand reports with visual help. It can evaluate performance parameters such as customer satisfaction index, employee satisfaction index, revenue generation, productivity, gross profit, etc.
The presentation deck is available for you for instant download, so get it now and reap all the benefits! It can save time and help teams understand performance at a glance without reading long reports. Also, add required KPIs and evaluate the operational performance of the ongoing projects.
[product_image id=134601]
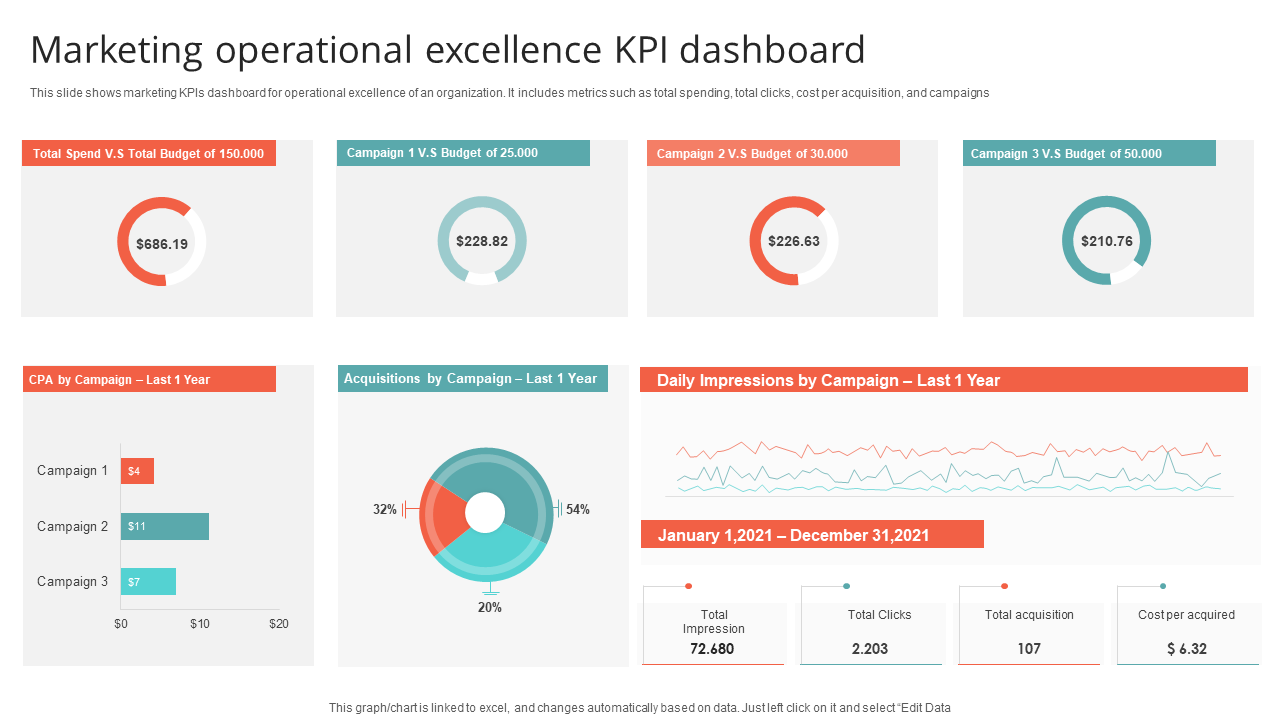
Template 3: Marketing Operational Excellence KPI Dashboard PPT Template
A Marketing Dashboard shows how well marketing teams are performing in real-time. It can assist your teams to stay focused, fix problems fast, and reach their goals with less effort. So, add this template to your list and illustrate the marketing KPIs for the operational excellence of your firm. It includes metrics such as total spending, total clicks, cost per acquisition, campaigns, etc. You can also modify the list and add a few elements for better results. Download the template now and help teams decide which platforms to spend time and money on.
Template 4: Key Initiatives For Operational Excellence Achieve PPT Powerpoint
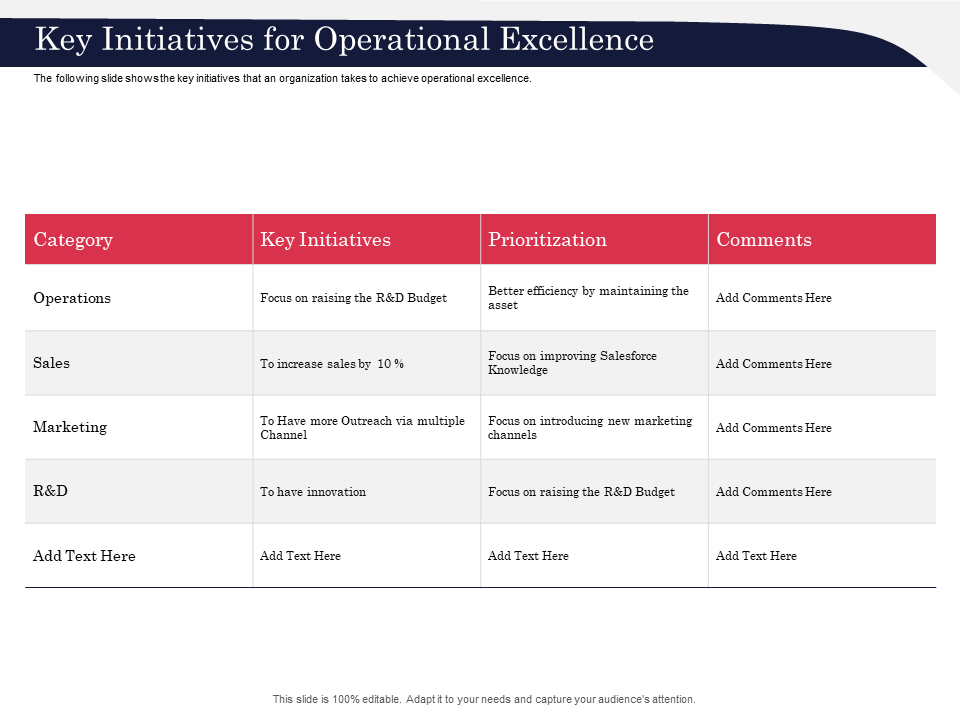
Key initiatives are basically planned actions to improve work, reduce waste, and boost overall results. They can help teams work smarter, cut extra steps, and deliver better service or products. You can use the following slide to describe the key initiatives that an organization can take to achieve operational excellence. It includes information about the initiatives for different categories, along with their prioritization status and comments. Now, click on the link below and get the template right away! It can help you share plans with your team in a simple and clear manner.
Template 5: Operational Improvement Process Dashboard for Continuous Monitoring
With an Operational Improvement Dashboard, you can analyze, track, and improve work quality of all your project tasks in real time. It can help your teams find weak areas and achieve the desired goals step by step. So, add this colorful template to your presentation deck and illustrate the KPI dashboard of operational improvement. Here, you can include metrics such as improving operational efficiency, streamlining quality, increasing profit margins, etc. This dashboard design is generally used for continuous monitoring that allows you to make small changes that lead to big progress. So, get it now and help project managers take necessary actions.

Template 6: Operational Performance Metrics Dashboard PPT Template
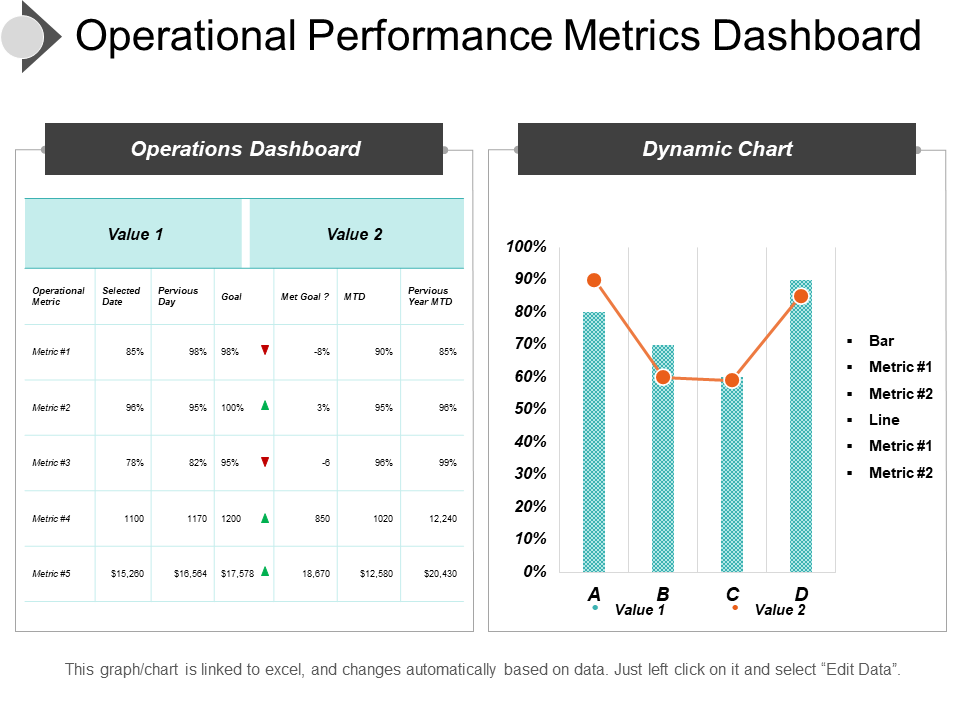
This visual tool explains how well a business is running. It can give a full view of the different operational metrics and monitor team performance in real-time. So, consider this template and learn how to display the values of the performance metrics in a structured way. It can help you decide your next step and save money by showing where time or effort is being wasted. So, get the template and keep everyone on the same page with simple visual reports.
Template 7: KPI Dashboard To Measure Effective IT Service Excellence
A KPI Dashboard for IT Services can show key numbers with which you can track how well your IT teams are doing. It can assist you in finding where delays happen and fixing them quickly. You can use the following template and build trust with other teams by proving IT performance in numbers. It includes information about tickets by status, satisfaction rate, category with SLA violation, etc. Download the template now and make the necessary modifications as per your requirements. Also, add charts, graphs, and sections that explain problems or wins during meetings without technical words.

Template 8: Innovation Dashboard with Relevant Operational Information PPT Template
The following template displays an attractive dashboard design with important operational details. It includes facts and figures related to all project ideas, updates, timelines, and project progress in one place. It can help your team track innovation work, timelines, and impact on business smoothly. Also, you can combine both creative and business sides in one clear dashboard and check how much time, cost, and effort each new idea needs. Now, click on the link and get the template. It can let your team members compare past and current innovation results in one view.

Template 9: Operational Efficiency Improvement Manufacturing Dashboard PPT Template
With a structured dashboard design, you can check all project tasks, timelines, and outcomes easily. It contains visual charts to show how ideas really grow into real business value. So, include this colorful template in your list and describe the operational improvement dashboard in a concise manner. It shows parameters such as project budget, overdue tasks, upcoming deadlines, average handling time, etc. So, get it now and save time by avoiding messy reports and scattered files.

Template 10: Key Initiatives for Operational Excellence Operations Playbook PPT Template
The following template shows relevant data related to the important operational initiatives of the ongoing projects. It includes details about marketing, sales, R&D, operations, finance, admin, etc., and can make your business ready for change and achieve growth and success. Download the template from the link and impress your viewers! YOu can use it to discuss your ideas and concepts with your team in clear and concise language.

Turn Data into Action
The Operational Excellence Dashboards are essential tools for your project operations as they track performance in real-time. They can improve your decision-making and promote overall team growth. They include all smart tools like KPI dashboards, continuous improvement dashboards, and business intelligence dashboards.
To get the best outcomes, use these above mentioned templates and prepare your dashboard reports. These documents provide ready to use designs that you can directly implement in your operations after making some changes. Also, based on your needs, you can add diagrams, charts, graphs, and relevant visuals. So, get the templates now and reap their benefits!
PS: Also, check out our Top 10 Operations Performance Dashboard Templates.
Operational Excellence Dashboard FAQs
1. What core KPIs are used to measure operational excellence in the dashboard?
These include employee/team/business productivity, cost efficiency, quality rates, defect rate, and delivery times. These KPIs can track equipment downtime, customer satisfaction, and safety incidents. Each of these numbers can support data-driven decision making. They can explain how well operations are running each day and where improvement is needed. Thus, these performance metrics can help leaders spot problems early and improve team performance.
2. How is real-time performance data integrated into the dashboard?
- Real-time data generally comes from sensors, software, and digital tools connected to the process.
- It updates automatically using cloud platforms or internal networks, and the data flows in from machines, apps, and employee inputs.
- This approach can help managers take quick action when issues appear, like using alerts for delays or equipment failures.
- Note that platforms like Power BI, Tableau, or even Excel-based templates can offer live monitoring with or system.automated refresh options.
3. Which metrics reflect adherence to continuous improvement initiatives?
Improvement metrics include error rates, waste reduction rates, rework levels, and process change results. These metrics help you understand how often your team meets set improvement goals. Also, there are feedback loops, audit results, and employee suggestion counts that you need to measure for long-term gains.