

Canada Maps Powerpoint Ppt Template Bundles





Try Before you Buy Download Free Sample Product
 Impress Your
Audience
 100%
Editable
 Save Hours
of Time


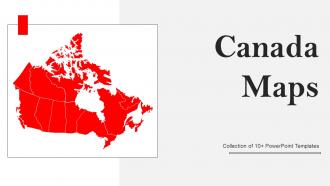
Introducing our comprehensive Canada Maps PowerPoint PPT package, a must-have for educators, researchers, and businesses. This dynamic presentation tool features a detailed blank map of Canada, providing a versatile canvas for customization. Dive deeper into regional insights with a dedicated Map of Ontario Province, perfect for localized analysis. Explore demographics effortlessly using the Canada Population Density Map, offering a visual representation of the nations distribution. Navigate strategic routes with precision using the Canada Road Network Map, ensuring your audience gains a holistic understanding of transportation infrastructure. Elevate your presentations with clarity and detail, empowering your audience to connect with Canadas geographical and demographic nuances. Upgrade your visual storytelling with this all-inclusive Canada Maps PPT package.
People who downloaded this PowerPoint presentation also viewed the following :
Canada Maps Powerpoint Ppt Template Bundles with all 17 slides:
Use our Canada Maps Powerpoint Ppt Template Bundles to effectively help you save your valuable time. They are readymade to fit into any presentation structure.








FAQs for Canada Maps Powerpoint
So for Canadian maps, it really depends what you're after. Physical ones show all the terrain stuff - mountains, rivers, that kind of thing. Good for hiking or just getting the lay of the land. Political maps are more about provinces and cities, which you'd want for school projects or whatever. There are also thematic ones covering population, climate zones (Canada's weather patterns are honestly wild when you see them mapped out). Topographic maps give you detailed elevation if you're doing serious outdoor stuff. What's your project about? That'll help narrow down which type makes sense.
So basically, topographic maps show you the actual land - mountains, rivers, how steep stuff is with those squiggly contour lines. Political maps are more about borders, cities, who runs what province. If you're hiking or doing outdoor stuff, definitely go with topographic. You can actually see if that trail's gonna kill your legs or where streams flow. Political ones are better for understanding government boundaries and population centers - though honestly, Google Maps covers most of that now. Think of it as "what does the ground look like" versus "what human decided this line goes here."
So Canada's geographical features are like the backbone of any thematic map you make. Mountains and rivers create these natural boundaries that totally shape where people live and where resources are found. Most maps layer data right onto these physical features because - honestly, it just makes sense. Climate patterns follow mountain ranges, economic stuff clusters around water bodies, you know? When you're making your own maps, terrain and elevation will mess with how your data looks, so pick your symbols carefully. Oh, and coastlines are huge for transportation networks too.
Oh man, mapping tech has gotten insane - we went from those old compass surveys (off by like hundreds of meters) to GPS that's accurate within centimeters. Your phone now has crazy detailed topo maps instead of buying those $15 paper ones. LiDAR mapping means they can finally map all that remote northern stuff properly, which is great because hiking through muskeg to survey sounds absolutely brutal. You can layer different data too - trails, wildlife zones, whatever. Honestly, check out the government's free mapping sites before your next trip. They're actually really solid now.
So Canadian mapping started way back with Indigenous peoples making these amazing birchbark maps - seriously, their geographical knowledge saved European explorers from getting completely lost. French and British cartographers jumped in during the 1600s-1700s, mapping coastlines and trade routes, though honestly their early attempts were pretty rough around the edges. Everything changed after Confederation in 1867 when they needed systematic surveys for the railway. Then the 1900s brought proper topographical work and eventually satellite tech. You should definitely check out Natural Resources Canada's historical collection - it's wild seeing how the whole country gradually appeared on paper over time.
Honestly, looking at indigenous maps totally changed how I think about Canadian geography. They focus on relationships to the land instead of just provincial borders - like traditional territories, seasonal hunting routes, sacred places. It's wild seeing familiar spots with their original names alongside the English/French ones we're used to. The whole approach treats land as this living, connected thing rather than something you carve up and own. Also random but Indigenous Services Canada has some really good resources if you want to dig deeper. Way more complete picture than the standard maps we grew up with.
Okay so Canada's basically got five main regions. Atlantic provinces are all about coastlines and fishing. Quebec's where you get the French culture plus the St. Lawrence River. Ontario has the Great Lakes and most of the population - kinda makes sense why Toronto's such a big deal. Then there's the Prairie provinces with all that flat farmland and oil stuff. BC gets the mountains and Pacific coast, which honestly sounds pretty nice. Oh and those northern territories? They're way bigger than they look on most maps. The geography really shapes everything - like how mountains and rivers naturally create these regional boundaries. Pretty cool how that works out.
Honestly, interactive maps are game-changers for checking out Canada's geography. Zoom from Arctic tundra straight down to the Great Lakes, flip between satellite and topographic views. The boreal forest will blow your mind - I had no idea how massive it actually was until I saw it this way. Toggle between provinces to compare landscapes instantly, or follow major rivers across the country. Natural Resources Canada has this cool interactive atlas that shows how geography connects to settlement patterns and wildlife stuff. Way better than staring at static maps that don't really show you the scale of everything.
So for Canada maps, ArcGIS Online and QGIS are your best options if you want proper mapping tools - they've got solid Canadian datasets built in. PowerBI is surprisingly good too, I've seen people make really slick Canada maps with it that looked way better than you'd expect. Canva works if you want something super user-friendly but basic. Google My Maps is fine for quick stuff, though pretty limited. Oh, and MapChart exists I guess - meh. Start with Stats Canada boundary files and just pick whatever tool matches your skill level and what you can afford.
So basically, climate data totally drives how mapmakers decide what to show on Canadian maps. You'll notice it most in vegetation zones - like whether something shows up as boreal forest or tundra. Temperature and rainfall patterns determine if an area looks like farmland or wilderness too. The colors and symbols they pick? That's all based on climate stuff. I never really thought about it before, but Canadian maps are basically just weather patterns turned into pictures. Makes sense when you think about it - helps you figure out what each region's actually gonna be like before you visit.
So for Canada you've got two main ones - Lambert Conformal Conic and Transverse Mercator. Lambert's perfect for the whole country since it handles our crazy east-west stretch without too much distortion, though it does squish the territories up north a bit. UTM zones use Transverse Mercator which is super accurate locally but gets weird over large areas. Works great for north-south stuff though. Honestly? Most people I know just use whatever ArcGIS defaults to and call it a day. Just pick based on your area and whether you need distances, areas, or shapes to be accurate.
So basically those population density maps show you exactly where Canada's money is. Toronto, Vancouver, Montreal - that's where everyone clusters because that's where the jobs are. Makes total sense when you think about it. The empty northern areas? Pretty much no economic opportunities, brutal winters, not much going on. A lot of Indigenous communities end up in those sparse regions too, which honestly reflects some pretty messed up historical stuff. If you're doing any kind of business analysis, definitely cross-reference with income data though - population density alone won't tell you everything about spending power.
Dude, your phone's gonna be useless out there - no cell towers and the cold kills batteries crazy fast. Paper maps work everywhere but reading topo maps is honestly kind of a skill you need to practice first. I'd take both though. Your GPS can be your main thing, just download offline maps before you leave. Pack extra batteries too. But seriously, learn how to read those paper maps beforehand because you don't want your first lesson to be when you're actually lost. Trust me on the backup thing.
Honestly, thematic maps are a game changer for Canadian geography stuff. They use colors and symbols to show where things are happening - like you can literally see Alberta's oil clusters or which regions are getting hit by deforestation. Way better than staring at endless data tables, trust me. These maps make it super obvious where problems are concentrated and how things change over time. I probably sound like a geography nerd, but seriously - if you're looking at any Canadian environmental issue, start with a thematic map first. You'll actually understand what's going on geographically before diving into all the details.
Oh man, Natural Resources Canada's website is your best bet - totally free maps you can download right away. Canadian Geographic Education has some solid lesson plans too. Kids go absolutely nuts for those giant floor maps where they can literally walk across the provinces (honestly don't get why but they love it). Google Earth works great for zooming into different areas, and there's the Atlas of Canada online. Start with the NRCan site though. You'll find classroom stuff that's ready to print, which saves you tons of time.
-
Easy to use and customize templates. Helped me give a last minute presentation.
-
Crisp and neat slides. Makes it fun and easier to curate presentations.