

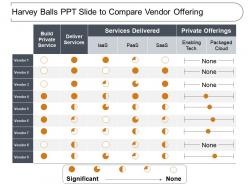
Harvey balls ppt slide to compare vendor offering





Try Before you Buy Download Free Sample Product
 Impress Your
Audience
 100%
Editable
 Save Hours
of Time


Deliver information to the assembly with our Harvey Balls Ppt Slide To Compare Vendor Offering. Get everyone aware of the events of the day.
People who downloaded this PowerPoint presentation also viewed the following :
Harvey balls ppt slide to compare vendor offering with all 6 slides:
Our Harvey Balls Ppt Slide To Compare Vendor Offering are effective in handling assignments. They assist you in building focus.


FAQs for Harvey balls ppt slide to
Harvey balls are circular symbols used to visually represent qualitative data, performance levels, or comparison metrics in presentations, with fill levels indicating degrees of completion, satisfaction, or achievement. These simple yet effective visual tools enhance audience comprehension by replacing complex numerical data with intuitive graphics, enabling presenters to communicate comparative analysis, project status updates, and performance evaluations more clearly and memorably.
Harvey balls enhance visual communication by replacing dense numerical data with intuitive circular symbols that instantly convey completion levels, performance ratings, and comparative assessments. These simple visual indicators streamline stakeholder comprehension across executive dashboards, project status reports, and strategic presentations, with many organizations finding that Harvey balls significantly reduce interpretation time while improving decision-making clarity and engagement.
Harvey balls originated from Harvey Poppel, a consultant at Booz Allen Hamilton, who created these simple circular symbols in the 1970s to visually represent qualitative data in consulting presentations. The term gained widespread adoption in business and consulting environments because these symbols effectively streamline complex comparisons, enhance client presentations, and deliver clear visual insights, with many organizations finding that Harvey balls significantly improve decision-making processes across industries.
Harvey balls can effectively enhance SWOT analysis presentations by providing visual clarity for strength assessments, opportunity rankings, weakness severity levels, and threat impact evaluations. These simple circular indicators streamline complex comparative data, enabling stakeholders to quickly identify priority areas across strategic planning sessions, with many consulting firms and corporate strategy teams finding that visual scoring accelerates decision-making processes.
Determining appropriate Harvey ball fill levels requires establishing clear criteria that correspond to specific performance ranges, such as 25% for poor, 50% for fair, 75% for good, and 100% for excellent performance metrics. Organizations typically define these thresholds based on quantitative data, benchmark comparisons, or qualitative assessments, with many finding that consistent scaling across all metrics enhances stakeholder comprehension and decision-making accuracy.
Best practices for incorporating Harvey balls into PowerPoint templates include maintaining consistent sizing, using standardized color schemes, aligning them properly with accompanying text, ensuring adequate spacing between elements, and creating clear legends for interpretation. These visual indicators streamline data presentation by enhancing readability, reducing cognitive load, and enabling faster decision-making, with many organizations finding that standardized Harvey ball templates ultimately deliver more effective executive communications and improved meeting efficiency.
Harvey balls offer more nuanced visual communication than binary checkmarks and provide cleaner, space-efficient displays compared to star ratings. While star ratings work well for customer reviews and checkmarks indicate simple yes/no status, Harvey balls excel in business contexts like feature comparisons, project dashboards, and performance matrices, ultimately delivering clearer stakeholder communication and more professional presentations across industries.
Harvey balls are particularly effective in consulting, project management, financial services, and healthcare sectors where complex data comparison is essential. These visual tools streamline decision-making processes by enabling stakeholders to quickly assess performance metrics, risk levels, and progress indicators across multiple variables, ultimately delivering clearer strategic insights and faster consensus-building in data-heavy environments.
Common mistakes include using too many categories that overwhelm audiences, inconsistent sizing that confuses comparisons, poor color choices that reduce visibility, overcrowding slides with excessive data points, and failing to provide clear legends or explanations. These visualization errors undermine decision-making clarity, with many organizations finding that simplified designs, consistent scales, and strategic color application enhance audience comprehension and deliver more impactful presentations.
Harvey balls simplify complex data by replacing detailed numbers with intuitive visual symbols that audiences can instantly interpret, reducing cognitive load and highlighting key patterns across multiple metrics simultaneously. These circular indicators enable executives to quickly compare performance levels, project statuses, or satisfaction ratings at a glance, ultimately streamlining decision-making processes and enhancing presentation clarity for stakeholders.
PowerPoint, Excel, Google Slides, and specialized presentation tools like SlideTeam offer built-in shapes and formatting options for creating custom Harvey balls. These platforms enable users to adjust fill percentages, colors, and sizing through shape formatting tools, with many organizations finding that template libraries and design add-ins streamline the creation process significantly.
Cultural differences significantly impact Harvey ball perception through varying interpretations of completion direction, color meanings, and visual metaphors across regions. While Western audiences typically read left-to-right completion patterns, other cultures may interpret filling directions differently, with many international organizations finding that standardized legends and consistent formatting help ensure universal comprehension regardless of cultural background.
Harvey balls effectively visualize qualitative assessments by converting subjective evaluations into standardized visual symbols, enabling consistent comparison across criteria like customer satisfaction, employee performance, or strategic initiatives. Organizations use them in performance reviews, vendor evaluations, and project assessments, with many finding that the visual format streamlines decision-making while maintaining nuanced qualitative insights.
Harvey balls enhance audience engagement by creating visual simplicity, reducing cognitive load, and enabling instant pattern recognition across complex data sets. These visual indicators trigger psychological responses that improve information retention, accelerate decision-making processes, and maintain audience attention spans, with many presenters finding that audiences process comparative information 60% faster while experiencing reduced mental fatigue during lengthy presentations.
Harvey balls enhance storytelling by combining with color coding, icons, trend arrows, and contextual charts to create layered visual narratives. This strategic combination enables presenters to show performance levels alongside directional trends, priority indicators, and comparative benchmarks, with many executives finding that integrated Harvey ball dashboards deliver faster decision-making and clearer strategic insights.
No Reviews