

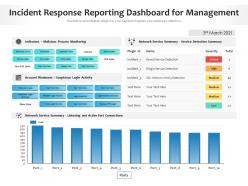
Incident response reporting dashboard for management





Try Before you Buy Download Free Sample Product
 Impress Your
Audience
 100%
Editable
 Save Hours
of Time


Our Incident Response Reporting Dashboard For Management are topically designed to provide an attractive backdrop to any subject. Use them to look like a presentation pro.
People who downloaded this PowerPoint presentation also viewed the following :
Incident response reporting dashboard for management with all 2 slides:
Use our Incident Response Reporting Dashboard For Management to effectively help you save your valuable time. They are readymade to fit into any presentation structure.

FAQs for Incident response reporting
Key incident response dashboard metrics include mean time to detection (MTTD), mean time to resolution (MTTR), incident severity distribution, active incident count, and escalation rates. These metrics enable organizations to streamline response workflows, optimize resource allocation, and enhance operational efficiency, with many IT departments finding that real-time visibility ultimately delivers faster resolution times and improved service reliability.
Visualization techniques enhance incident response dashboards by providing real-time status indicators, interactive heat maps, and intuitive alert prioritization systems that enable rapid threat assessment. Through color-coded severity levels, timeline visualizations, and drag-and-drop incident workflows, security teams can streamline response times, minimize operational confusion, and ultimately deliver faster threat resolution with improved organizational security posture.
Real-time data serves as the foundation of effective incident response dashboards, enabling immediate threat detection, accurate situation assessment, coordinated response efforts, and continuous monitoring of remediation progress. Through live data feeds, security teams can identify incidents within minutes rather than hours, track evolving threats across networks, and coordinate multi-team responses seamlessly, ultimately minimizing damage and reducing recovery time significantly.
Industries customize incident response dashboards by integrating sector-specific metrics, compliance requirements, regulatory frameworks, and operational priorities into their monitoring systems. Healthcare focuses on patient safety indicators and HIPAA compliance, financial services emphasize fraud detection and regulatory reporting, while manufacturing prioritizes equipment downtime and safety protocols, ultimately enabling faster decision-making and improved operational resilience.
Common tools for building incident response dashboards include Splunk, Elastic Stack, Grafana, Tableau, and Microsoft Power BI, alongside specialized security platforms like IBM QRadar and Phantom. These technologies streamline incident management by providing real-time monitoring, automated alerting, and comprehensive data visualization, with many organizations finding that integrated dashboards significantly reduce response times and enhance operational efficiency.
Best practices for designing an intuitive incident response dashboard include prioritizing critical alerts at the top, using color-coded severity levels, implementing clear visual hierarchies, providing real-time status updates, and ensuring one-click escalation paths. These design principles streamline emergency workflows by reducing cognitive load, accelerating decision-making, and minimizing response times, with many security teams finding that intuitive interfaces ultimately enhance operational efficiency during high-stress incidents.
Machine learning enhances incident response dashboards by automating threat detection, predicting attack patterns, reducing false positives, and accelerating root cause analysis through pattern recognition algorithms. These capabilities enable security teams to identify anomalies faster, prioritize critical incidents more effectively, and streamline response workflows, with many organizations finding that ML-driven dashboards significantly reduce incident resolution times while improving overall security posture.
Common pitfalls include overcomplicating interfaces with excessive metrics, failing to customize alerts for different stakeholder needs, neglecting real-time data integration, and inadequate staff training on dashboard functionality. These challenges often result in delayed response times and missed critical incidents, with many organizations finding that streamlined, role-based dashboards with automated escalation protocols ultimately deliver faster resolution and improved operational efficiency.
Incident response dashboards should integrate with SIEM systems through real-time data feeds, automated alert correlation, shared threat intelligence databases, and unified workflow orchestration. This strategic combination enables security teams to streamline threat detection, accelerate response times, and maintain comprehensive visibility across their entire security infrastructure, ultimately delivering faster incident resolution and enhanced organizational resilience.
Audience analysis for incident response dashboards should examine user roles, technical expertise levels, decision-making authority, and information consumption patterns across stakeholders like IT teams, executives, and operations staff. This strategic assessment enables organizations to tailor data visualization, alert prioritization, and reporting depth appropriately, with many finding that role-specific customization significantly enhances response times and operational efficiency.
Incident response dashboards aid prioritization by providing real-time visibility into threat severity, affected systems, and business impact through automated scoring algorithms and visual indicators. These platforms enable security teams to allocate resources strategically by displaying workload distribution, team availability, and escalation pathways, with many organizations finding that centralized dashboards reduce response times and optimize personnel deployment during critical incidents.
Compliance considerations include data encryption standards, access control protocols, audit trail requirements, regulatory reporting capabilities, and privacy protection measures. These frameworks ensure adherence to industry-specific regulations like HIPAA for healthcare, SOX for financial services, and GDPR for data protection, with many organizations finding that compliant dashboards ultimately deliver enhanced security transparency and streamlined regulatory reporting.
Feedback loops enhance incident response dashboards by identifying usability gaps, prioritizing critical features, and refining alert accuracy based on real-world usage patterns. Through user insights, organizations streamline workflow integration, reduce false positives, and improve response times, with many IT teams finding that continuous feedback ultimately delivers more intuitive interfaces and faster incident resolution capabilities.
Healthcare systems like Kaiser Permanente and financial institutions such as JPMorgan Chase have leveraged incident response dashboards to reduce system downtime by 40-60% and accelerate resolution times significantly. These organizations found that centralized visibility enabled faster threat detection, streamlined communication between security teams, and improved compliance reporting, ultimately delivering enhanced customer trust and operational resilience in increasingly complex digital environments.
Incident response dashboard data should be updated in real-time or near real-time intervals, typically every 1-5 minutes, with critical security alerts refreshing continuously to ensure immediate threat visibility. Many cybersecurity teams find that automated data feeds from SIEM systems, network monitors, and security tools enable faster incident detection, more accurate threat assessment, and ultimately more effective response coordination during active security events.
-
Excellent products for quick understanding.
-
Out of the box and creative design.
-
Attractive design and informative presentation.
-
Excellent design and quick turnaround.