


Indonesia powerpoint maps




Try Before you Buy Download Free Sample Product
 Impress Your
 Audience
 100%
100% Editable
 Save Hours
 of Time


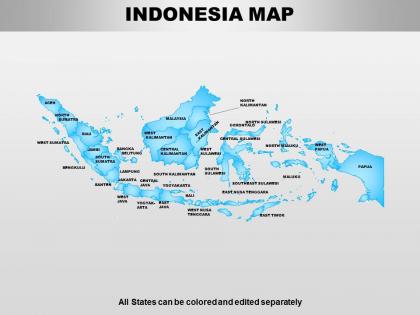
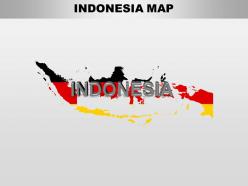
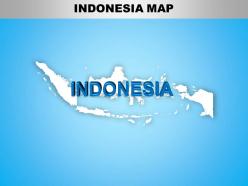
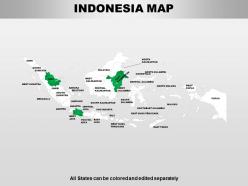
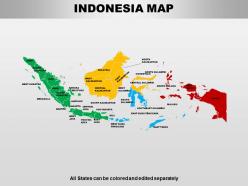
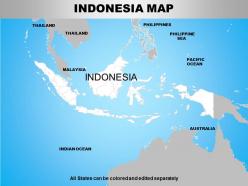
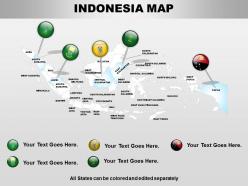
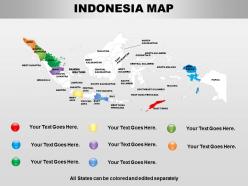
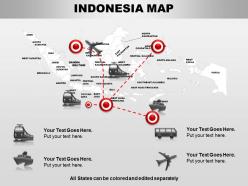
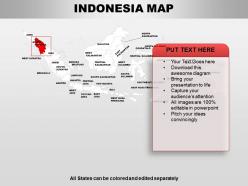
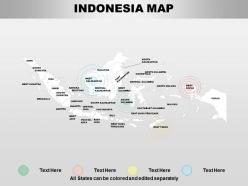
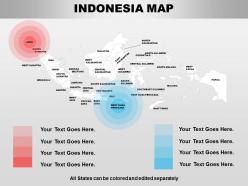
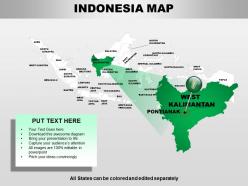
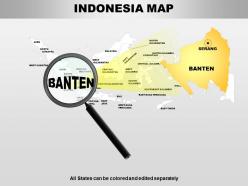
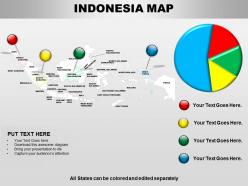
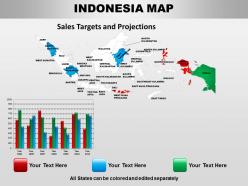
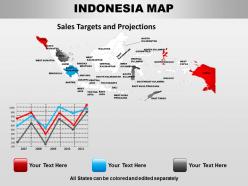
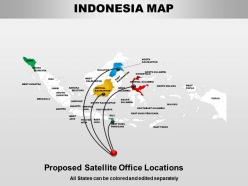
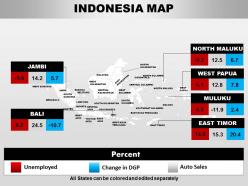
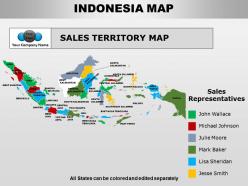
Suffuse an insightful energy in the business presentations on international operations of your enterprise by focusing on the key country which is the subject of your discussion by using our PowerPoint maps such as this one of Indonesia here which is as elegant as it is informative. To take a holistic look at the status of performance of sales and marketing team, response from customers, level of coverage across administrative divisions, spread of retail outlets and presence of joint developers at the national level in Indonesia, this PowerPoint slide design is a readymade representation of all the administrative divisions of the country spread across a vast expanse land and sea. Give your PPT presentation on any topic ranging from business expansion plan, sales growth strategy, population distribution, prospective locations for industrial plant set-up, opportunity for infrastructural investment, physical connectivity projects, housing development etc. to a vast variety of audience such as government representatives, international investors, business partners and so on. Our Indonesia Powerpoint Maps get you compliments. Earn the acclaim of your colleagues.
People who downloaded this PowerPoint presentation also viewed the following :
Indonesia powerpoint maps with all 29 slides:
Lock your thoughts in our Indonesia Powerpoint Maps. They will surely click with your audience.
FAQs for
Indonesia PowerPoint maps feature accurate archipelago geography with detailed island representations, customizable regional divisions, cultural color schemes, and editable provincial boundaries that generic templates lack. These specialized maps enable businesses, educators, and government agencies to deliver precise geographical presentations for market analysis, educational content, and strategic planning, while maintaining cultural authenticity and professional credibility in Indonesian-focused communications.
Indonesia PowerPoint maps enhance geography and cultural studies education by providing visual context for archipelago complexity, demographic distributions, economic regions, and cultural diversity across thousands of islands. These interactive tools enable educators to highlight specific provinces, compare regional characteristics, and demonstrate Indonesia's strategic position in Southeast Asia, ultimately delivering more engaging lessons while helping students grasp spatial relationships and cultural connections.
Indonesia PowerPoint maps can incorporate population density heat maps, economic indicators through color-coded regions, infrastructure networks, trade flow arrows, and demographic breakdowns by province. These visualizations enhance presentations by transforming complex statistical data into easily digestible visual narratives, with many businesses finding that geographic data representation significantly improves stakeholder comprehension and decision-making processes.
Indonesia PowerPoint maps facilitate economic presentations by providing clear visual frameworks for displaying regional GDP data, investment flows, infrastructure projects, and development disparities across provinces. Through customizable geographic templates, businesses and government agencies can effectively communicate market opportunities, resource allocation strategies, and growth projections, while highlighting specific regions like Java, Sumatra, or emerging markets in Eastern Indonesia, ultimately delivering compelling narratives that support strategic decision-making.
Customizable Indonesia PowerPoint maps offer enhanced visual storytelling, geographic context for market analysis, professional presentation aesthetics, and flexible data visualization capabilities. These strategic tools enable businesses to showcase regional expansion plans, highlight market penetration across Indonesian provinces, and demonstrate location-based insights, ultimately delivering clearer stakeholder communication and more compelling investment proposals.
NGOs can leverage Indonesia PowerPoint maps by highlighting project locations, visualizing beneficiary distribution across regions, showcasing program coverage areas, and demonstrating geographic impact through data overlays and infographics. These visual tools enable organizations to present compelling funding proposals, communicate regional needs effectively, and illustrate community outreach success, ultimately enhancing donor engagement and strategic planning capabilities.
**INPUT**: What design elements should be considered when creating Indonesia PowerPoint maps for a professional audience? **OUTPUT**: Professional Indonesia PowerPoint maps should incorporate clear color coding, readable typography, accurate geographical boundaries, interactive elements, and consistent branding aligned with corporate standards. These design elements enhance audience comprehension by ensuring visual clarity, maintaining professional credibility, and enabling effective data storytelling, with many organizations finding that well-designed regional maps significantly improve stakeholder engagement and decision-making processes.
Including cultural landmarks in Indonesia PowerPoint maps enhances tourism presentations by providing visual context, highlighting key destinations, establishing cultural authenticity, and creating memorable storytelling opportunities that resonate with diverse audiences. These enhanced maps enable tourism agencies, travel companies, and hospitality businesses to showcase Indonesia's rich heritage more effectively, ultimately delivering more compelling presentations that drive visitor interest and booking conversions.
**INPUT**: What software compatibility issues should users be aware of when utilizing Indonesia PowerPoint maps? **OUTPUT**: Indonesia PowerPoint maps may encounter compatibility challenges across different PowerPoint versions, operating systems, font availability, and color rendering variations. These issues can affect formatting consistency, especially when sharing presentations between Windows and Mac systems, while newer versions increasingly support enhanced graphics features, ultimately enabling seamless collaboration and professional presentations across diverse platforms. **Word count: 54 words**
Indonesia PowerPoint maps enhance environmental conservation storytelling by visualizing deforestation patterns, biodiversity hotspots, protected areas, pollution sources, and conservation project locations across the archipelago's 17,000 islands. These visual tools enable environmental organizations, government agencies, and conservation groups to present complex ecological data more compellingly, ultimately driving stronger stakeholder engagement and support for critical conservation initiatives.
Interactive features significantly enhance Indonesia PowerPoint maps by enabling clickable regions for detailed province data, hover effects revealing demographic statistics, animated transitions showing economic trends, and embedded hyperlinks to supporting documents. These capabilities transform static presentations into engaging experiences, allowing presenters to navigate seamlessly between national overviews and local insights while maintaining audience attention and delivering more comprehensive regional analysis.
Historical timelines presented through Indonesia PowerPoint maps aid understanding by visualizing territorial changes, colonial periods, independence movements, and regional developments across the archipelago's complex geography. These visual presentations enable educators, researchers, and students to comprehend how Indonesia's diverse islands unified into a nation, while tracking cultural migrations, trade routes, and political transformations that shaped modern Indonesia.
Best practices for sourcing accurate geographic data for Indonesia PowerPoint maps include using government databases like BPS-Statistics Indonesia, partnering with certified GIS providers, leveraging OpenStreetMap community data, consulting national mapping agencies, and cross-referencing multiple authoritative sources. These approaches streamline data validation by ensuring currency, accuracy, and regulatory compliance, with many organizations finding that combining official government sources with verified commercial datasets ultimately delivers the most reliable foundation for professional presentations.
Digital marketing agencies utilize Indonesia PowerPoint maps to visualize demographic data, consumer behavior patterns, regional purchasing power, and market penetration rates across different provinces and cities. These visual tools enable agencies to identify high-opportunity markets, allocate advertising budgets strategically, and customize campaigns for specific regions, ultimately delivering more targeted marketing strategies and improved ROI for clients.
Common pitfalls include overcrowding maps with excessive text, using poor color contrast that reduces readability, neglecting to highlight key regions relevant to your message, choosing inappropriate scale levels, and failing to maintain visual consistency across slides. These design errors can confuse audiences and dilute your presentation's impact, with many presenters finding that simplified, strategically focused maps with clear visual hierarchy deliver significantly better audience engagement and comprehension.
-
Great product with highly impressive and engaging designs.
-
Use of icon with content is very relateable, informative and appealing.
-
nice