


Introduction to google search console performance tab edu ppt




Try Before you Buy Download Free Sample Product
 Impress Your
 Audience
 100%
100% Editable
 Save Hours
 of Time


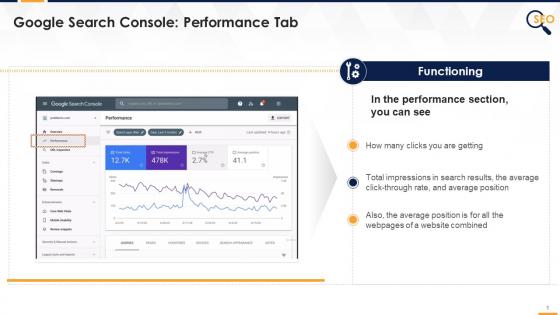
This slide covers google search console performance section details such as total clicks, impressions, average CTR, positioning, etc.
People who downloaded this PowerPoint presentation also viewed the following :
Introduction to google search console performance tab edu ppt with all 16 slides:
Use our Introduction To Google Search Console Performance Tab Edu Ppt to effectively help you save your valuable time. They are readymade to fit into any presentation structure.







FAQs for Introduction to google search console performance
Focus on clicks, impressions, CTR, and average position. Clicks tell you actual traffic from search. Impressions show how often you're appearing in results. Low CTR? Your titles and meta descriptions suck - fix those first. I honestly don't stress about exact position numbers, but if they're dropping consistently, that's a problem. Oh, and filter by your best-performing pages to see which keywords bring the most clicks. That's usually where you'll find easy wins without doing a ton of work.
So impressions are just how often your pages showed up in Google results. Clicks are when people actually clicked through to your site. Pretty straightforward stuff. Divide clicks by impressions and you get your click-through rate - honestly one of the most telling metrics you can track. High impressions but terrible clicks? Your titles and meta descriptions probably suck. People are seeing your stuff but not biting. I'd focus on the pages already ranking decent but getting ignored. Those are your quick wins since Google already likes them.
So CTR is basically how often people actually click your stuff when it shows up in Google. Simple math - if you got 100 views and 5 clicks, that's 5%. Low numbers? Your titles and descriptions probably suck. Nobody wants to click boring copy. High CTR means you're nailing those snippets. I'd dig into Search Console and find your worst performers first. Way easier than guessing which pages need help. Then just rewrite those titles to be more... I dunno, interesting? Something that makes people curious enough to actually click instead of scrolling past.
Go to Performance tab and hit "Queries" - that's where all the magic happens. You'll see every search term driving traffic to your site with clicks, impressions, CTR, and position data. Default view sorts by clicks which is pretty useful. I always check impressions too though, since those show terms you're ranking for but not getting clicks on. Honestly, those high impression/low CTR queries are goldmines for quick fixes. Click any query to see which pages rank for it. Start optimizing there first - way easier wins than chasing brand new keywords.
Average Position basically tells you where your pages rank in Google search results. Think of it like a report card for your visibility. The lower the number, the better - position 1 means you're at the top. If you're sitting at position 15, you're stuck on page 2 where people rarely click. Honestly, anything past page 1 might as well be invisible these days. It's super useful for tracking if your SEO work is paying off. I'd focus on keywords that are hovering around positions 8-12 since those are closest to breaking into the top spots and actually getting clicks.
Just click the date picker at the top of Performance tab and pick whatever timeframe you want. There's preset options like "Last 3 months" or you can do custom dates. I always grab at least 16 months of data - helps you catch seasonal stuff that might be throwing off your numbers. The charts update automatically once you set it. Oh, and there's this "Compare" toggle next to the date picker that's honestly pretty handy for year-over-year comparisons. Takes out the guesswork when you're trying to figure out if that traffic drop was seasonal or actually something to worry about.
Oh this is actually pretty cool stuff! Geographic data tells you exactly which countries are sending you clicks and impressions. Sometimes you'll discover you're randomly popular somewhere you never expected (happened to me with Canada once, no clue why). You can spot missed opportunities in markets that should be hitting your site but aren't. Filter by country to see what search terms work best where - super useful for figuring out if you need localized content. Honestly, it's one of the better ways to decide which international markets are worth focusing your energy on first.
Yeah just go to the Performance tab and click "Page" in the filters. Then you can either scroll through your URLs or search for whatever page you want to track. I'm always doing this to see which posts are actually getting traffic - it's honestly one of my favorite features. Oh, and you can select multiple pages and hit "Compare" if you want to see how they stack up against each other. One thing I learned the hard way: bookmark the filtered views for pages you check all the time. Saves you from having to redo the whole filter setup every single time.
Yeah so mobile gets way more impressions but the click rates are pretty terrible compared to desktop. People on phones are just lazier scrollers I guess? They barely look past the first few results. Desktop users actually browse around more and click on stuff. The difference can be huge sometimes - like shockingly different. Since most traffic is mobile now, spend time making your titles and snippets look good on small screens. Oh and definitely check both breakdowns regularly because weird stuff happens - your desktop rankings might be dying while mobile stays fine, or the other way around.
Go to the "Queries" tab in Performance - that's where all your search terms live with clicks, impressions, CTR, and position data. Sort by whatever column you want to see what's crushing it. Position data always surprises me tbh, like you think you know where you rank but... yeah. Use the filter at the top to drill down to specific keywords. Here's the cool part: compare CTR against position. Shows you which keywords are total overachievers and which ones are basically wasting good rankings. Super useful for figuring out what's actually working.
Your titles and meta descriptions need work - people are finding you but not clicking through. Start with your highest impression pages since that's where you'll see the biggest impact. Look at what queries are driving those views and check if your titles actually match what people want. I've seen sites ranking for totally random stuff they never targeted! Compare your titles to what's ranking above you. Usually tweaking them to be more specific helps, or throw in power words like "best" or "2024." Your meta descriptions should grab attention and include the main keyword. Don't overthink it though - sometimes small changes make a huge difference.
Check your top queries first - those show what's already working for you. High impressions but crappy click rates? Your titles probably suck. Low impressions means you're not targeting those keywords hard enough. I'd also hunt down pages that are bleeding traffic over time since those need a refresh. The clicks data is honestly where the magic happens - it tells you exactly what topics people actually want from you. Grab your top 10 performing queries and think of 3-5 related angles you haven't hit yet. That's your content roadmap right there.
So total metrics are just everything added up for whatever time period you picked - like 5,000 total clicks over 30 days. Averages break it down per day, so that'd be roughly 167 clicks daily. Honestly, I usually go with totals when I'm showing results to my boss or clients because... well, bigger numbers just look more impressive lol. But averages are super helpful for spotting patterns and figuring out what's normal day-to-day performance. Quick rule: use totals for those "look how awesome we did" reports, averages for planning your next moves.
Dude, check your "New" and "Lost" queries sections every week - they're seriously underrated. Lost queries are actually way more useful than new ones because they show you what broke. Maybe you messed up some pages or Google's being weird about your content. New queries tell you what's suddenly working, which is cool for spotting trends. I always export both lists and compare them to whatever changes I made recently. Sounds nerdy but it's saved my butt so many times when rankings tanked.
Sharp drops in Search Console usually mean something's broken - crawling errors, indexing problems, maybe even a penalty. Your rankings tanking? Could be your content doesn't match what people actually want anymore, or competitors just stepped up their game. Don't freak out over daily changes though - I always tell people to wait 2-3 weeks before panicking. Seasonal stuff throws everyone off too (learned that the hard way). Check if you made site changes recently, look for algorithm updates, and definitely peek at the manual actions tab. Cross-reference everything before you lose sleep over it.
-
Appreciate the research and its presentable format.
-
Innovative and Colorful designs.