

Key success indicators dashboard powerpoint slide show





Try Before you Buy Download Free Sample Product
 Impress Your
Audience
 100%
Editable
 Save Hours
of Time


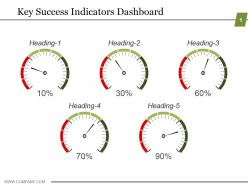
Download this key success indicators dashboard PowerPoint slide show to represent how successfully your organization is accomplishing key business targets. This editable key success indicators dashboard PPT template consists of five speedometers showcasing the different level of percentage of success. This success performance dashboard presentation template additionally encourages the business specialists to design and plan the business success structure to coordinate the business' objectives. Keeping customers need in mind, our graphic and presentation designers has crafted this template slide. Template self-descriptive graphics design will help you explain the success report in more clear way. By applying this template design, let your presentation speak for you. If you are thinking to design a presentation on Key Performance Indicator, KPI dashboard, business performance management, success management, business goals achievement, performance analytics, you can use this key outcome indicators template slide. To help you out, we provide additional instructional slides with each template so that you can easily edit the slide design as per needs. Download this key success indicators dashboard PowerPoint slide. Be the backbone with our Key Success Indicators Dashboard Powerpoint Slide Show. Display a firm and determined approach to growth.
People who downloaded this PowerPoint presentation also viewed the following :
Key success indicators dashboard powerpoint slide show with all 5 slides:
Remove The clutter with our Key Success Indicators Dashboard Powerpoint Slide Show. Give your views that neat and tidy look.


FAQs for Key success indicators dashboard
Critical financial KPIs for small businesses include cash flow, gross profit margin, accounts receivable turnover, debt-to-equity ratio, and customer acquisition cost versus lifetime value. These metrics enable owners to monitor liquidity, profitability, and growth sustainability while identifying operational inefficiencies, with many small enterprises finding that tracking these indicators delivers better resource allocation and competitive positioning.
KPIs can be tailored by identifying industry-specific metrics, incorporating regulatory requirements, focusing on customer journey touchpoints, and emphasizing competitive differentiators unique to each sector. Financial services might prioritize loan approval times and fraud detection rates, while healthcare organizations focus on patient satisfaction scores and readmission rates, ultimately delivering measurable progress toward strategic objectives and operational excellence.
Leading KPIs predict future performance through metrics like customer acquisition rates, employee engagement scores, and pipeline velocity, while lagging KPIs measure past results including revenue, customer satisfaction, and market share. This strategic combination enables organizations to anticipate trends and adjust strategies proactively, with many companies finding that balancing both types ultimately delivers more agile decision-making and competitive advantage.
Organizations effectively track and analyze KPIs in real-time through integrated dashboard systems, automated data collection tools, cloud-based analytics platforms, and AI-powered monitoring solutions that consolidate multiple data sources. These technologies streamline decision-making by providing instant visibility into performance metrics, enabling proactive adjustments, and delivering actionable insights, with many companies finding that real-time KPI tracking significantly enhances operational efficiency and competitive responsiveness.
Qualitative KPIs provide essential context and depth to quantitative metrics by measuring customer satisfaction, employee engagement, brand perception, and stakeholder relationships that numbers alone cannot capture. These indicators enable organizations to understand the "why" behind performance trends, with many companies in retail, healthcare, and financial services finding that qualitative insights drive strategic decisions, enhance customer experiences, and ultimately deliver sustainable competitive advantage.
KPIs enhance employee performance and engagement by providing clear expectations, enabling regular feedback, tracking skill development, and recognizing achievements through measurable goals. Through transparent performance dashboards, organizations streamline communication, motivate teams with visible progress tracking, and align individual contributions with company objectives, ultimately delivering improved productivity and job satisfaction across departments.
Startup KPIs focus on growth metrics, user acquisition, and cash runway, while established companies emphasize operational efficiency, market share, and profitability indicators. Startups benefit from agile, weekly tracking of customer acquisition costs and retention rates, whereas established organizations leverage comprehensive dashboards monitoring quarterly performance across multiple departments, ultimately enabling both to optimize resource allocation and accelerate strategic decision-making in their respective growth phases.
Businesses ensure KPI relevance through regular quarterly reviews, alignment with evolving strategic objectives, stakeholder feedback integration, and market condition assessments. Many organizations establish KPI governance committees that evaluate metric performance, retire outdated indicators, and introduce new measurements reflecting changing business priorities, ultimately maintaining strategic focus and competitive advantage in dynamic markets.
Customer satisfaction surveys should prioritize Net Promoter Score (NPS), Customer Satisfaction Score (CSAT), Customer Effort Score (CES), retention rates, and resolution time metrics. These KPIs enable organizations to measure loyalty, experience quality, and service efficiency across touchpoints, with many companies finding that combining multiple metrics delivers comprehensive insights for strategic improvements and competitive advantage.
KPIs vary significantly across marketing channels, with social media focusing on engagement rates, reach, impressions, and follower growth, while email marketing emphasizes open rates, click-through rates, conversion rates, and list growth. These channel-specific metrics reflect different customer interaction patterns, with social media prioritizing brand awareness and community building, and email marketing targeting direct conversions and customer retention.
Companies face challenges including data integration from multiple systems, selecting relevant metrics that align with strategic goals, ensuring data accuracy and real-time updates, and achieving user adoption across departments. These implementation hurdles often stem from siloed information, unclear objectives, and resistance to change, with many organizations finding that executive buy-in and comprehensive training ultimately streamline dashboard effectiveness and drive measurable business outcomes.
Businesses effectively communicate KPI results through visual dashboards, executive summaries, regular reporting cycles, stakeholder-specific presentations, and contextual narratives that explain performance trends. These approaches streamline data interpretation by highlighting key insights, comparing results against targets, and connecting metrics to strategic objectives, with many organizations finding that tailored communication formats enhance stakeholder engagement and drive actionable decision-making across departments.
KPIs in project management enable strategic oversight by tracking budget adherence, timeline milestones, resource utilization, quality metrics, and stakeholder satisfaction throughout project lifecycles. These indicators streamline decision-making by identifying bottlenecks early, optimizing resource allocation, and facilitating data-driven adjustments, with many organizations finding that consistent KPI monitoring ultimately delivers improved project outcomes and enhanced competitive advantage.
Technology streamlines KPI data collection and visualization through automated data integration, real-time dashboards, predictive analytics, and cloud-based reporting platforms. These solutions enable organizations to gather metrics from multiple sources simultaneously, create interactive visual displays, and deliver actionable insights instantly, with many companies finding significantly improved decision-making speed and operational transparency.
Overlooked industry-specific KPIs include patient readmission rates in healthcare, inventory turnover velocity in retail, loan default prediction accuracy in banking, employee safety incident frequency in manufacturing, and customer acquisition cost per channel in SaaS companies. These specialized metrics often deliver deeper operational insights than standard KPIs, enabling organizations to identify inefficiencies, optimize resource allocation, and enhance competitive positioning within their specific market landscapes.
-
Illustrative design with editable content. Exceptional value for money. Highly pleased with the product.
-
Awesomely designed templates, Easy to understand.