

Kpi Dashboard To Optimize Inventory Management System Logistics And Supply Chain Management





Try Before you Buy Download Free Sample Product
 Impress Your
Audience
 100%
Editable
 Save Hours
of Time


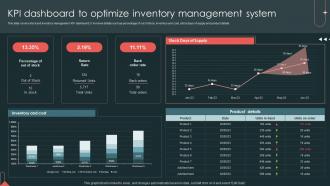
This slide covers stock and inventory management KPI dashboard. It involves details such as percentage of out of stock, inventory and cost, stock days of supply and product details.
People who downloaded this PowerPoint presentation also viewed the following :
Kpi Dashboard To Optimize Inventory Management System Logistics And Supply Chain Management with all 7 slides:
Use our Kpi Dashboard To Optimize Inventory Management System Logistics And Supply Chain Management to effectively help you save your valuable time. They are readymade to fit into any presentation structure.






FAQs for Kpi Dashboard To Optimize Inventory Management System Logistics And
Effective marketing KPI dashboards should include lead generation metrics, conversion rates, customer acquisition costs, return on advertising spend, and website traffic analytics. These metrics enable marketing teams to optimize campaign performance, allocate budgets strategically, and demonstrate ROI, with many organizations finding that comprehensive dashboards streamline decision-making and enhance overall marketing effectiveness.
A KPI dashboard helps align team objectives with business goals by providing real-time visibility into performance metrics, establishing clear accountability measures, and creating transparent connections between individual contributions and organizational outcomes. Through centralized data visualization, teams can track progress against strategic targets, identify alignment gaps quickly, and adjust priorities dynamically, ultimately ensuring coordinated efforts that drive measurable business results.
**INPUT**: What are the best practices for visualizing KPIs to ensure clarity and engagement? **OUTPUT**: Best practices for KPI visualization include using consistent color schemes, choosing appropriate chart types, maintaining clean layouts, implementing progressive disclosure, and ensuring mobile responsiveness. These approaches streamline decision-making by reducing cognitive load, highlighting critical trends, and enabling quick pattern recognition, with many organizations finding that strategic dashboard design ultimately delivers faster insights and enhanced stakeholder engagement across all business levels. [Word count: 60 words]
KPI dashboards should be updated based on business needs and data velocity, with real-time updates for critical metrics like sales or customer service, daily updates for operational metrics, and weekly or monthly updates for strategic indicators. Many organizations find that automated refresh schedules, ranging from hourly for financial services to weekly for project management, ensure stakeholders have timely insights while maintaining system performance and decision-making effectiveness.
Effective KPI dashboard tools include Tableau, Power BI, Qlik Sense, Google Data Studio, and Looker, each offering distinct visualization capabilities and integration options. These platforms streamline data analysis by providing real-time updates, customizable widgets, and automated reporting features, with many organizations finding that cloud-based solutions like Power BI and Data Studio deliver faster implementation and enhanced collaboration across departments.
KPI dashboards can be customized through role-based access controls, department-specific metrics selection, personalized visualizations, and tailored reporting frequencies that align with each team's objectives. Sales teams might focus on conversion rates and pipeline metrics, while HR departments track employee satisfaction and retention rates, with finance teams monitoring cash flow and profitability indicators, ultimately delivering targeted insights that enhance departmental efficiency.
Data accuracy serves as the foundation for effective KPI dashboards, directly impacting decision-making quality, strategic planning reliability, and stakeholder confidence in reported metrics. Without precise data, organizations risk making costly strategic errors, misallocating resources, and losing competitive advantage, with many companies finding that even minor inaccuracies can cascade into significant operational inefficiencies and compromised business outcomes.
Organizations ensure actionable KPIs by integrating real-time data feeds, establishing clear ownership structures, and implementing automated alert systems that trigger specific responses when thresholds are breached. Through strategic dashboard design, companies streamline decision-making processes, enhance operational efficiency, and accelerate response times, with many finding that connecting KPI insights directly to workflow systems ultimately delivers faster problem resolution and improved business outcomes.
Training team members in KPI dashboard interpretation involves establishing data literacy fundamentals, conducting hands-on workshops with real scenarios, and creating role-specific interpretation guides that connect metrics to business outcomes. Through structured learning sessions, mentorship programs, and regular practice with actual dashboard data, organizations enhance decision-making capabilities, improve response times to performance changes, and ultimately deliver more strategic insights across teams.
Determining KPI monitoring frequency depends on business velocity, decision-making cycles, and data volatility, with operational metrics requiring daily tracking while strategic KPIs need weekly or monthly analysis. Organizations typically monitor sales performance daily, customer satisfaction monthly, and financial metrics quarterly, with many companies finding that aligning review frequency to specific business rhythms and decision points ultimately delivers more actionable insights.
Effective KPI communication strategies include visual dashboards with clear metrics, regular stakeholder meetings with actionable insights, customized reports for different audience levels, storytelling with data context, and automated alerts for critical changes. These approaches streamline decision-making by presenting complex performance data accessibly, enabling faster strategic responses, and ultimately delivering enhanced organizational alignment and accountability across all business functions.
Historical data enhances KPI dashboard design by establishing baseline performance metrics, revealing seasonal trends and patterns, and identifying correlations between different business variables. By analyzing past performance across quarters and years, organizations can create predictive benchmarks, set realistic targets, and configure alert thresholds that reflect actual business cycles, ultimately delivering more accurate forecasting and strategic insights.
Organizations should avoid cluttering dashboards with too many metrics, selecting vanity metrics over actionable KPIs, lacking stakeholder input during design, and failing to align metrics with strategic objectives. Many companies find that overcomplicated interfaces, poor data quality, and infrequent updates ultimately undermine dashboard effectiveness, while successful implementations prioritize user-focused design and regular performance reviews.
KPI dashboards integrate into business reviews by providing standardized data visualization, automated reporting schedules, and real-time performance tracking across departments. Organizations streamline their review processes by embedding dashboards into monthly board meetings, weekly team assessments, and quarterly strategic planning sessions, ultimately enabling faster decision-making and consistent performance monitoring.
User feedback improves KPI dashboard functionality by identifying visualization gaps, highlighting missing metrics, revealing navigation challenges, and uncovering data accuracy issues. Through targeted surveys and usage analytics, organizations streamline interface design, enhance data presentation clarity, and customize reporting features, ultimately delivering more intuitive dashboards that accelerate decision-making processes across departments.
-
Amazing product with appealing content and design.
-
SlideTeam provides PPTs on every single topic. Their templates suit my job very well. I am very grateful!