

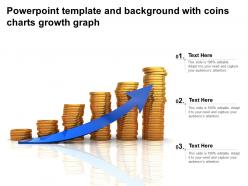
Powerpoint template and background with coins charts growth graph





Try Before you Buy Download Free Sample Product
 Impress Your
Audience
 100%
Editable
 Save Hours
of Time


Our Powerpoint Template And Background With Coins Charts Growth Graph are topically designed to provide an attractive backdrop to any subject. Use them to look like a presentation pro.
People who downloaded this PowerPoint presentation also viewed the following :
Powerpoint template and background with coins charts growth graph with all 2 slides:
Use our Powerpoint Template And Background With Coins Charts Growth Graph to effectively help you save your valuable time. They are readymade to fit into any presentation structure.
FAQs for Powerpoint template and background with coins
A coins growth graph template should include clear axis labels, consistent time intervals, data point markers, trend lines, and a legend for multiple currencies or investment types. These elements enhance readability by providing context, enabling quick comparisons, and highlighting growth patterns, with many financial institutions finding that well-designed templates significantly improve investor comprehension and decision-making processes.
Different types of coins can be represented through distinct visual elements like contrasting colors, separate trend lines, or dual-axis configurations that accommodate varying scales and volatility patterns. Cryptocurrency presentations often use more dynamic styling with steeper curves, while traditional currencies employ steadier progressions, with many financial institutions finding that side-by-side comparisons effectively demonstrate portfolio diversification and risk management strategies.
Green and gold color schemes work best for highlighting growth trends in coins, with green representing positive growth and gold symbolizing financial prosperity and stability. These strategic combinations enhance visual clarity by creating strong contrast against neutral backgrounds like white or light gray, while red accents can highlight downturns, ultimately delivering clear, professional presentations that communicate financial performance effectively to stakeholders and investors.
Effective annotation of coins growth graphs involves strategic labeling of key data points, time periods, market events, and percentage changes that directly correlate with growth patterns. Clear legends, milestone markers, and contextual notes help viewers quickly identify trends, while color-coded annotations and callout boxes highlighting significant growth phases enable stakeholders to make informed investment decisions and track portfolio performance more efficiently.
Timeframes determine the granularity and relevance of data visualization in coins growth graph templates, affecting how stakeholders interpret trends, patterns, and investment decisions. Strategic timeframe selection enables financial analysts, cryptocurrency traders, and investment firms to showcase short-term volatility versus long-term growth trajectories, ultimately delivering more targeted insights and enhanced decision-making capabilities for diverse audiences.
A template facilitates comparisons by standardizing visual elements like timeframes, axis scales, chart types, and color coding across multiple coins' data sets. This consistent framework enables viewers to quickly identify performance patterns, relative growth rates, and market correlations, with financial analysts and investment teams finding that standardized presentations significantly enhance decision-making accuracy and portfolio optimization strategies.
**INPUT**: What software or platforms are recommended for creating and customizing coins growth graph templates? **OUTPUT**: Recommended platforms include Microsoft PowerPoint, Excel, Google Slides, Canva, and specialized presentation tools like SlideTeam's templates. These solutions streamline visualization creation by offering pre-designed layouts, customizable elements, and professional formatting options, with many financial institutions finding that ready-made templates significantly reduce preparation time while enhancing investor presentations and strategic communications. **Word count: 54 words**
Interactive features enhance static coins growth graph templates by enabling hover effects for detailed data points, clickable segments for drill-down analysis, animated transitions between time periods, and dynamic filtering options. These capabilities transform passive presentations into engaging experiences, allowing stakeholders to explore financial trends at their own pace, with banks and investment firms finding that interactive elements significantly improve client comprehension and decision-making during strategic meetings.
Common mistakes when designing coins growth graphs include using inconsistent scales, overcrowding with excessive data points, neglecting proper labeling, choosing inappropriate time intervals, and failing to provide clear context for the financial metrics displayed. These design flaws can mislead stakeholders by distorting growth trends, confusing audiences with cluttered visuals, and undermining credibility, with many organizations finding that clean, accurately scaled presentations enhance investor confidence and strategic decision-making.
Trends and patterns in coin growth can be predicted using historical data through technical analysis, moving averages, volume indicators, support and resistance levels, and seasonal pattern recognition. These analytical methods enable traders and investors to identify market cycles, price momentum, and potential breakout points, with many financial institutions finding that combining multiple indicators with proper risk management delivers more accurate forecasting and strategic investment decisions.
A coins growth graph template should be tailored for financial institutions, investment firms, cryptocurrency platforms, banking professionals, and business stakeholders tracking monetary performance. These audiences benefit from clear visual representations of financial growth, portfolio performance, and investment returns, with many organizations finding that tailored templates enhance client presentations, improve stakeholder communication, and streamline financial reporting processes.
Incorporating additional data like market sentiment, trading volume, regulatory news, and social media trends transforms a basic coins growth graph into a comprehensive analytical tool. These supplementary metrics enable investors and analysts to identify correlation patterns, predict potential price movements, and understand market dynamics beyond simple price fluctuations, ultimately delivering more informed investment decisions.
Best practices for exporting coins growth graph templates include choosing appropriate file formats like PNG for web use, PDF for print materials, SVG for scalability, and PowerPoint for presentations. These formats ensure optimal quality across different platforms, with many financial institutions and investment firms finding that maintaining consistent resolution, color profiles, and chart readability enhances professional presentation standards.
A coins growth graph template adapts to currency volatility through dynamic scaling, flexible time intervals, percentage-based measurements, and customizable volatility indicators that automatically adjust to different market conditions. These features enable financial analysts, investment firms, and cryptocurrency platforms to track dramatic price swings, comparative performance across multiple currencies, and long-term trends, ultimately delivering clearer insights for strategic investment decisions in increasingly volatile digital asset markets.
Annotations and markers transform coins growth graphs from basic visualizations into comprehensive analytical tools by highlighting critical milestones, trend changes, performance benchmarks, and contextual events that influenced growth patterns. These visual elements enable stakeholders to quickly identify correlation points, seasonal variations, and strategic opportunities, with many financial institutions and investment firms finding that well-annotated growth charts significantly enhance decision-making processes and client presentations.
-
Enough space for editing and adding your own content.
-
Topic best represented with attractive design.
-
Great designs, really helpful.
-
Awesome presentation, really professional and easy to edit.
-
Top Quality presentations that are easily editable.
-
Nice and innovative design.