

Diapositives de présentation PowerPoint d'analyse prédictive





Try Before you Buy Download Free Sample Product
 Impress Your
Audience
 100%
Editable
 Save Hours
of Time


Adaptez le domaine croissant de l'informatique à votre entreprise avec ces diapositives de présentation PowerPoint d'analyse prédictive. Utilisez efficacement cette conception PowerPoint pour décrire l'importance d'un outil de veille stratégique émergent qui aide votre entreprise à collecter et à analyser les données commerciales. Vous pouvez utiliser cette conception PPT pour expliquer l'importance de cette technologie basée sur le cloud pour le succès et la croissance des organisations. Cette présentation d'analyse prédicative sera utilisée pour améliorer les décisions commerciales, en augmentant le taux d'intérêt de l'association sur le montant dépensé en ventes ou en marketing. L'analyse prédictive est un concept qui aide l'entreprise à renforcer ses procédures et fonctions commerciales globales. Ainsi, commencez à créer une présentation PowerPoint d'analyse prédicative pour que le public potentiel connaisse ces outils commerciaux émergents qui non seulement aident à gérer les informations commerciales, mais permettent également d'atteindre les objectifs commerciaux pour son succès continu dans le secteur des affaires. Dites cheerio aux doutes avec nos diapositives de présentation Powerpoint d'analyse prédictive. Offrez à votre public vos réflexions décisives.
People who downloaded this PowerPoint presentation also viewed the following :
Contenu de cette présentation Powerpoint
Diapositive 1 : Cette diapositive présente Predictive Analytics en tant que titre titulaire. Écrivez le nom de votre entreprise et lancez-vous.
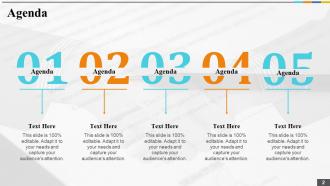
Diapositive 2 : Il s'agit d'une diapositive d'ordre du jour. Indiquez votre agenda ici.
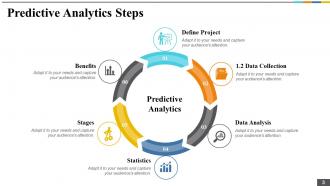
Diapositive 3 : Cette diapositive montre 6 étapes de l'analyse prédictive. Les étapes incluses sont : Définir le projet, la collecte de données, l'analyse des données, les étapes statistiques et les avantages
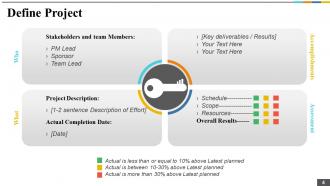
Diapositive 4 : Cette diapositive affiche Définir le projet avec quoi, qui, réalisations, évaluations comme paramètres à remplir. Rédigez la description du projet, la date d'achèvement réelle, les principaux livrables et les parties prenantes (responsable du PM, sponsor, chef d'équipe) et les résultats (portée, calendrier, ressources) avec trois indicateurs de couleur.
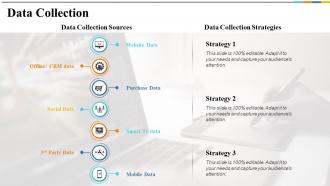
Diapositive 5 : Cette diapositive couvre les sources de collecte de données (données tierces, données de site Web, données d'achat, données sociales, données Smart Tv, données mobiles, données hors ligne/CRM) avec des stratégies de collecte de données.
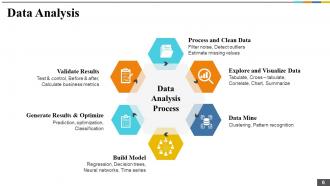
Diapositive 6 : Cette diapositive couvre le processus d'analyse des données avec les titres suivants : Traiter et nettoyer les données (filtrer le bruit, détecter les valeurs aberrantes, estimer les valeurs manquantes), explorer et visualiser les données (tabuler, recouper, corréler, graphique, résumer), extraire les données (Clustering, Pattern reconnaissance), Générer des résultats et optimiser (Prédiction, optimisation, Classification), Valider les résultats (Test et contrôle, Avant et après, Calculer les métriques commerciales), Construire un modèle (Régression, Arbres de décision, Réseaux de neurones, Séries temporelles).
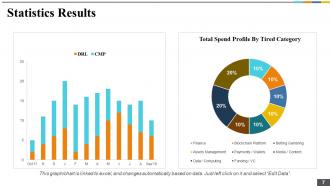
Diapositive 7 : Cette diapositive affiche les statistiques du profil des dépenses totales par catégorie fatiguée.
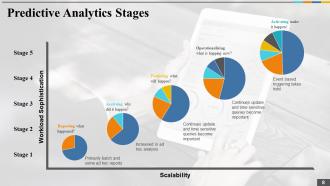
Diapositive 8 : Cette diapositive affiche les étapes de l'analyse prédictive en termes d'évolutivité et de sophistication de la charge de travail. Les étapes indiquées sont : Rapport de ce qui s'est passé ? Principalement des rapports par lots et quelques rapports ad hoc. Analyser pourquoi est-ce arrivé? Augmentation de l'analyse ad hoc. Prédire ce qui va se passer ? La mise à jour continue et les requêtes urgentes deviennent importantes. Opérationnaliser ce qui se passe maintenant ? La mise à jour continue et les requêtes urgentes deviennent importantes. Activez-le ! - Le déclenchement basé sur les événements s'installe.
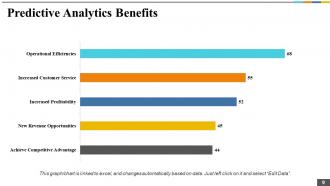
Diapositive 9 : Cette diapositive présente un graphique à barres des avantages de l'analyse prédictive.
Diapositive 10 : Cette diapositive montre une image Pause-café.
Diapositive 11 : Cette diapositive est intitulée diapositives supplémentaires qui doivent être utilisées si nécessaire.
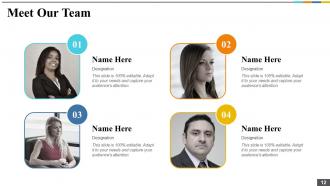
Diapositive 12 : Cette diapositive présente Rencontrez notre équipe avec une désignation, des zones de texte et une image adaptées.
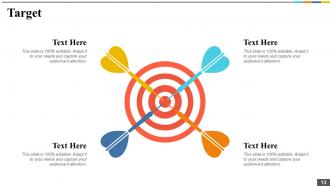
Diapositive 13 : Cette diapositive affiche l'image cible avec des zones de texte.
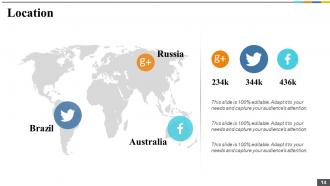
Diapositive 14 : Cette diapositive affiche une carte du monde avec quelques villes (Russie, Brésil et Australie) avec un nombre d'abonnés différent.
Diapositive 15 : Cette diapositive affiche une image de loupe avec des zones de texte.
Diapositive 16 : Cette diapositive s'intitule Tableaux et graphiques.
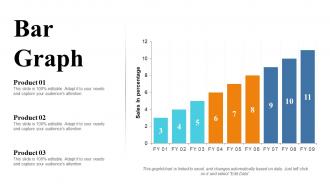
Diapositive 17 : Cette diapositive présente un graphique à barres avec une comparaison des produits pour les exercices respectifs.
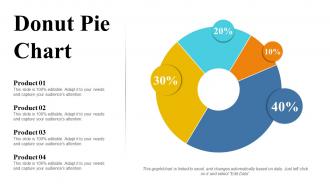
Diapositive 18 : Cette diapositive affiche un graphique à secteurs en anneau pour afficher les pourcentages d'entités.
Diapositive 19 : Il s'agit d'une diapositive de remerciement avec l'adresse, l'adresse e-mail et le numéro de contact.
Diapositives de présentation Powerpoint d'analyse prédictive avec les 19 diapositives :
Profitez de la grande commodité de nos diapositives de présentation Powerpoint d'analyse prédictive. Fonctionne en toute liberté.




FAQs for Predictive Analytics
So predictive analytics is basically using old data to guess what's coming next - pretty useful before making big calls. Companies are doing this everywhere now. Retailers figure out what you'll buy, banks spot risky loans, hospitals predict patient stuff. Manufacturing uses it to catch equipment problems early (which honestly saves them tons). Marketing teams love it for campaign planning. Some of these models are getting crazy accurate too. Instead of just going with your gut, you're making moves based on actual patterns. Fewer expensive screw-ups, plus you catch opportunities others miss. I'd say start with just one thing in your department first.
Honestly, predictive analytics is a game changer for this stuff. Look at your customer behavior - things like dropping usage, tons of support tickets, late payments. Those are your red flags right there. Build a model around whatever patterns you're seeing most. Once you can spot who's about to bail, you can actually do something about it before they're gone. Same thing works for figuring out what they'll want to buy next or when they'll need help. I'd start simple though - even basic predictions can seriously help your retention numbers. Way better than just waiting around for customers to leave.
Honestly, the messiest part is always your data - way worse than you'd expect. Missing chunks, weird formats, systems that just refuse to work together. Leadership wants results yesterday but doesn't get why it takes time. Plus good ML people cost a fortune, and even when you build something decent, try explaining to your boss why the model flagged certain customers. It's like being a fortune teller who has to show their work. My advice? Pick one small project where you can show quick wins first, then expand once people see it actually works.
Dude, data quality is seriously everything for predictive models. Your algorithms will pick up on all the wrong stuff if you've got missing values, duplicates, or messy inconsistencies floating around. Clean data helps models spot actual trends instead of random noise. I've literally watched models jump 40-50% in performance just from decent data cleaning - it's wild how much difference it makes. The annoying thing? Data prep eats up like 80% of your time on these projects. My advice: audit your data sources early and build some validation rules so you don't get burned later.
Honestly, predictive analytics is a game-changer for supply chains. You can forecast demand so you're not drowning in inventory or scrambling when you run out. Equipment maintenance becomes way easier too - predict failures before your conveyor belt dies during Black Friday (been there, not fun). Routes and delivery schedules get optimized using traffic and weather data. Oh, and you'll spot supplier issues before they blow up in your face. I'd say start with demand forecasting for your bestsellers first. Don't try to boil the ocean right away - build from there once you see results.
Honestly? Just start with Python and scikit-learn if your team knows coding - it handles most predictive stuff you'll need. R's solid too, especially for stats-heavy work. If coding isn't your thing, Tableau's analytics features are pretty decent, and Excel's forecasting tools are way better than they used to be (who knew, right?). I see so many teams jumping straight into fancy neural networks when basic regression would totally work. My advice: pick whatever your team already uses, start simple, then get fancier later if you actually need it.
So predictive analytics is pretty much looking at your data to catch problems before they blow up. Models dig through historical stuff and flag risky situations early - like which customers might default or when fraud's about to spike. Way better than scrambling after everything falls apart, honestly. You can actually adjust your approach ahead of time, maybe tighten up lending or put money aside for the hit. Market volatility predictions help too. My advice? Figure out what keeps you up at night risk-wise and build models for those areas first.
Bias is the big scary one - your model can totally discriminate if it learned from crappy historical data. Privacy's another nightmare since you're basically predicting people's lives with their personal info. Most companies suck at transparency, but people should know when algorithms are making decisions about them. Also, did anyone actually consent to this? Like, really consent, not just click "agree" on some 50-page terms thing. Test everything across different groups and document your ethics process early. Oh, and prepare for awkward conversations with leadership about fairness vs. profit.
So ML basically finds patterns in your data that you'd never catch on your own. It handles huge datasets and gets smarter over time without you having to reprogram anything. What's really neat is these algorithms don't just follow preset rules - they figure out what actually matters for making predictions. Traditional stats methods? You have to tell them exactly what relationships to look for upfront. ML discovers those connections by itself. Oh, and definitely start with simple stuff like linear regression - I made the mistake of jumping straight into deep learning and got totally overwhelmed.
Yeah, totally doable! Companies do this all the time now. Netflix recommendations? That's predictive analytics running while you browse. Same with credit card fraud alerts - they're analyzing your transaction in real-time. The trick is training your models beforehand, then deploying them through APIs that can handle tons of requests super fast. You'd use something like Kafka for streaming data (honestly took me forever to wrap my head around that one). Cloud services work great too. Pick one specific problem where instant predictions actually matter for your business first.
Healthcare's all about patient privacy and getting things right - people's lives depend on it. But retail? Totally different game - you're chasing seasonal patterns and figuring out why customers buy random stuff. Financial companies obsess over fraud detection and staying compliant with regulations (so boring but necessary). Manufacturing cares most about predicting when machines will break down. The data types vary wildly between industries too. You really need to chat with people who know your specific field before diving into any modeling. Each industry has its own weird constraints and success metrics that'll completely change your approach.
Look, Netflix is wild - their algorithm basically controls 80% of what people binge. Amazon's whole inventory thing saves them crazy money by predicting what we'll buy. Walmart somehow knows exactly which stuff to stock before hurricanes even hit certain areas (kinda creepy but smart). UPS cuts their fuel costs by constantly figuring out better routes. Healthcare places like Kaiser actually spot patients who might end up back in the hospital and help them before it happens. Honestly, just start small with whatever data you already have. Pick one problem where you can actually see if it worked or not.
Okay so first thing - get your baseline numbers locked down before you start anything. Pick like 2-3 metrics that actually matter to your business goals and track those religiously. Look for stuff like "cut inventory costs by 15%" or "boosted retention 8%" - real numbers, not fluffy metrics. Here's the annoying part though: figuring out what improvements actually came from your analytics vs everything else happening at once. That attribution stuff gets super messy, not gonna lie. Focus on the obvious wins - revenue bumps from better forecasting, money saved from efficiency gains, or catching churn before it happens. Just don't overthink it at first.
Honestly, you're gonna need both the tech stuff and business sense. Start with Python or R - pick one and stick with it. SQL's a must too since you'll constantly be grabbing data from databases. Statistics and ML are your bread and butter - regression, classification, that whole thing. But here's what they don't tell you enough: explaining your work to people who aren't technical is huge. Like, maybe more important than the actual coding sometimes? Time series forecasting is super useful too. My advice? Get decent with one language first, learn a few core algorithms, then practice breaking down your analysis for your non-tech friends. Trust me on that last part.
AI tools are getting way easier to use - like drag-and-drop stuff that doesn't need a data science degree. Real-time analytics is becoming standard now instead of just batch processing. Edge computing's pretty big too, so predictions happen right where data gets collected rather than bouncing everything to the cloud first. The coolest part? Marketing teams can build their own churn models without waiting forever for IT to get around to it. That democratization thing is honestly game-changing. I'd mess around with AutoML tools now before your CEO inevitably drops the "we need AI-powered insights" bomb next quarter and you're scrambling.
-
I discovered this website through a google search, the services matched my needs perfectly and the pricing was very reasonable. I was thrilled with the product and the customer service. I will definitely use their slides again for my presentations and recommend them to other colleagues.
-
Informative presentations that are easily editable.
-
Amazing product with appealing content and design.