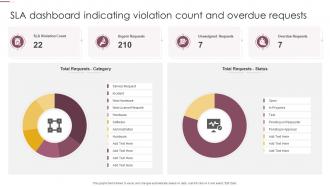
SLA Dashboard Indicating Violation Count And Overdue Requests
Try Before you Buy Download Free Sample Product
Audience
Editable
of Time
Our SLA Dashboard Indicating Violation Count And Overdue Requests are topically designed to provide an attractive backdrop to any subject. Use them to look like a presentation pro.
People who downloaded this PowerPoint presentation also viewed the following :
SLA Dashboard Indicating Violation Count And Overdue Requests with all 7 slides:
Use our SLA Dashboard Indicating Violation Count And Overdue Requests to effectively help you save your valuable time. They are readymade to fit into any presentation structure.
FAQs for SLA Dashboard Indicating Violation Count
Key SLA dashboard metrics include response time, resolution time, uptime percentage, customer satisfaction scores, and ticket volume trends. These metrics enable organizations to monitor service quality, identify bottlenecks, and optimize resource allocation, with many companies finding that comprehensive dashboards ultimately deliver improved customer experiences and operational efficiency.
Visualizations in SLA dashboards enhance data interpretation by transforming complex metrics into intuitive charts, graphs, and heat maps that enable rapid pattern recognition and trend identification. These visual elements streamline performance monitoring across departments, with many organizations finding that stakeholders can quickly identify bottlenecks, track compliance rates, and make data-driven decisions more effectively than traditional reporting methods.
**INPUT**: What tools or software are most recommended for creating an SLA dashboard? **OUTPUT**: Recommended SLA dashboard tools include Tableau, Power BI, Grafana, ServiceNow, and Splunk, each offering real-time monitoring capabilities and customizable reporting features. These platforms streamline performance tracking by automating data collection, enabling visual analytics, and delivering actionable insights, with many organizations finding that integrated dashboard solutions ultimately enhance operational efficiency and service accountability.
SLA dashboards should be updated in real-time or near real-time for critical metrics, with comprehensive reviews conducted weekly or monthly depending on service complexity and stakeholder requirements. Through automated data integration and scheduled reporting cycles, organizations in sectors like IT services, telecommunications, and financial services can maintain accuracy while enabling proactive performance management, ultimately delivering enhanced transparency and faster issue resolution.
Organizations face challenges including data integration complexities, defining accurate metrics, ensuring real-time updates, managing stakeholder alignment, and maintaining dashboard relevance across departments. These implementation hurdles often stem from siloed systems, inconsistent data formats, and varying performance expectations, with many companies finding that strategic planning and cross-functional collaboration ultimately streamline adoption and enhance operational transparency.
An SLA dashboard helps identify service improvement areas by highlighting performance gaps, tracking recurring issues, and analyzing trends across different service categories and timeframes. Through real-time monitoring and historical data analysis, organizations can pinpoint bottlenecks, resource constraints, and process inefficiencies, ultimately enabling targeted improvements that enhance customer satisfaction and operational efficiency.
Customer feedback drives SLA dashboard design by identifying critical service metrics, performance gaps, and priority areas that matter most to users. This input enables organizations to customize dashboards with relevant KPIs, adjust thresholds based on actual expectations, and create more meaningful reporting structures, ultimately delivering better service alignment and stronger customer relationships.
Real-time data integration enhances SLA dashboard effectiveness by providing instant performance visibility, enabling proactive issue resolution, and delivering accurate compliance tracking across all service touchpoints. This immediate data flow allows organizations to identify bottlenecks quickly, adjust resource allocation dynamically, and maintain consistent service quality, ultimately reducing response times and improving customer satisfaction while minimizing costly SLA breaches.
SLA dashboard best practices include clear visual hierarchies, real-time status indicators, customizable views for different stakeholders, automated alerting systems, and intuitive drill-down capabilities. These design principles streamline performance monitoring by reducing cognitive load, enabling faster issue identification, and enhancing decision-making across teams, with many organizations finding that well-designed dashboards significantly improve service delivery responsiveness.
Historical data in SLA dashboards can be effectively represented through trend charts, performance comparisons, compliance timelines, heat maps, and rolling averages. These visualizations enable organizations to identify patterns, track improvement trajectories, and benchmark current performance against past metrics, with many IT departments and service providers finding that historical context enhances strategic decision-making and proactive issue resolution.
Setting realistic SLA targets ensures achievable performance standards while maintaining customer satisfaction and operational efficiency, preventing team burnout and unrealistic expectations. These targets should be visualized through clear dashboard metrics with color-coded performance indicators, trend analysis charts, and threshold warnings, enabling organizations to track progress transparently while identifying improvement opportunities and maintaining competitive service delivery standards.
An SLA dashboard facilitates better communication between IT and business units by providing transparent, real-time visibility into service performance metrics, shared accountability frameworks, and clear escalation protocols. This transparency enables both teams to align on priorities, proactively address potential issues, and collaborate on strategic improvements, ultimately delivering enhanced operational efficiency and stronger cross-departmental partnerships that drive business outcomes.
Stakeholder engagement techniques include regular training sessions, customizable dashboard views, automated alert systems, interactive reporting features, and scheduled review meetings. These approaches streamline communication by providing relevant metrics to each stakeholder group, enabling proactive issue resolution, and fostering accountability, with many organizations finding that personalized dashboards significantly enhance participation and strategic decision-making.
Industry standards significantly influence SLA dashboard design by establishing common metrics, reporting formats, compliance requirements, and performance benchmarks that ensure consistency and regulatory adherence. These standards enable organizations across sectors like telecommunications, healthcare, and financial services to create dashboards that facilitate vendor comparisons, regulatory reporting, and stakeholder communication, ultimately delivering enhanced transparency and operational accountability.
Organizations should watch for AI-powered predictive analytics, real-time automated remediation, integration with IoT devices, enhanced mobile accessibility, and blockchain-based transparency features in SLA dashboard technology. These advancing capabilities streamline monitoring by predicting potential breaches, automating responses, and delivering comprehensive visibility, with many enterprises finding that proactive dashboards ultimately enhance service reliability and competitive positioning.
-
Keep doing the good work guys. Surpass the needs and expectations always!!
-
SlideTeam provides PPTs on every single topic. Their templates suit my job very well. I am very grateful!