Powerpoint Templates for Data Reporting
Save time and engage your audience with our fully editable PowerPoint PPT Templates and Slides.
-

Strategic Financial Data Reporting PPT Sample AT
Step up your game with our enchanting Strategic Financial Data Reporting PPT Sample AT deck, guaranteed to leave a lasting impression on your audience. Crafted with a perfect balance of simplicity, and innovation, our deck empowers you to alter it to your specific needs. You can also change the color theme of the slide to mold it to your companys specific needs. Save time with our ready made design, compatible with Microsoft versions and Google Slides. Additionally, its available for download in various formats including JPG, JPEG, and PNG. Outshine your competitors with our fully editable and customized deck.
-

Using Data Reporting To Improve Organizational Performance PPT PowerPoint AT
Do not compromise on a template that erodes your messages impact. Introducing our engaging Using Data Reporting To Improve Organizational Performance PPT PowerPoint AT complete deck, thoughtfully crafted to grab your audiences attention instantly. With this deck, effortlessly download and adjust elements, streamlining the customization process. Whether you are using Microsoft versions or Google Slides, it fits seamlessly into your workflow. Furthermore, it is accessible in JPG, JPEG, PNG, and PDF formats, facilitating easy sharing and editing. Not only that you also play with the color theme of your slides making it suitable as per your audiences preference.
-
Enterprise Data Reporting PPT Demonstration VA
Too often reporting ends up as a static grid of numbers that no one truly reads. You need a way to turn raw enterprise data into a clear compelling story for your stakeholders. This enterprise data reporting PPT demonstration does exactly that bridging the gap between complex analytics and actionable insight. Each of the carefully crafted business slides is built around modern slide design principles making dense information digestible through smart data visualization and clean creative layouts. The presentation deck works as a complete strategy deck allowing you to showcase key performance drivers with clarity and confidence every single time.
-
ESG Data Reporting And Management Dashboard PPT Information AT
Ditch the Dull templates and opt for our engaging ESG Data Reporting And Management Dashboard PPT Information AT deck to attract your audience. Our visually striking design effortlessly combines creativity with functionality, ensuring your content shines through. Compatible with Microsoft versions and Google Slides, it offers seamless integration of presentation. Save time and effort with our pre-designed PPT layout, while still having the freedom to customize fonts, colors, and everything you ask for. With the ability to download in various formats like JPG, JPEG, and PNG, sharing your slides has never been easier. From boardroom meetings to client pitches, this deck can be the secret weapon to leaving a lasting impression.
-
Regulatory Compliance In Environmental Data Reporting PPT Information AT
Do not compromise on a template that erodes your messages impact. Introducing our engaging Regulatory Compliance In Environmental Data Reporting PPT Information AT complete deck, thoughtfully crafted to grab your audiences attention instantly. With this deck, effortlessly download and adjust elements, streamlining the customization process. Whether you are using Microsoft versions or Google Slides, it fits seamlessly into your workflow. Furthermore, it is accessible in JPG, JPEG, PNG, and PDF formats, facilitating easy sharing and editing. Not only that you also play with the color theme of your slides making it suitable as per your audiences preference.
-
Automated Data Reporting PPT Example VA
Amidst the fastpaced world of data analytics this automated data reporting PowerPoint presentation template is a gamechanger. Offering a blend of visually captivating graphics and userfriendly editable slides it ensures your insights resonate with both technical and nontechnical audiences. The modern slide design allows for seamless integration of infographics and data visualization turning complex information into compelling narratives. Whether youre presenting to stakeholders or pitching to investors this presentation deck elevates your corporate communications. Experience the future of professional presentations with a template that enhances clarity and engages viewers making your data truly impactful.
-
Best Practices For Monitoring Reporting Data Accuracy And Reliability PPT Summary AT
Ditch the Dull templates and opt for our engaging Best Practices For Monitoring Reporting Data Accuracy And Reliability PPT Summary AT deck to attract your audience. Our visually striking design effortlessly combines creativity with functionality, ensuring your content shines through. Compatible with Microsoft versions and Google Slides, it offers seamless integration of presentation. Save time and effort with our pre-designed PPT layout, while still having the freedom to customize fonts, colors, and everything you ask for. With the ability to download in various formats like JPG, JPEG, and PNG, sharing your slides has never been easier. From boardroom meetings to client pitches, this deck can be the secret weapon to leaving a lasting impression.
-
Big Data Reporting Tools Overview PPT Information AT
Step up your game with our enchanting Big Data Reporting Tools Overview PPT Information AT deck, guaranteed to leave a lasting impression on your audience. Crafted with a perfect balance of simplicity, and innovation, our deck empowers you to alter it to your specific needs. You can also change the color theme of the slide to mold it to your companys specific needs. Save time with our ready made design, compatible with Microsoft versions and Google Slides. Additionally, its available for download in various formats including JPG, JPEG, and PNG. Outshine your competitors with our fully editable and customized deck.
-
Data Integration And Reporting PPT Information VA
Delivering insights through innovative data integration and reporting is key in todays business landscape. This engaging PowerPoint template empowers you to craft a compelling narrative around your findings utilizing modern slide design to present complex information clearly. With professionally designed layouts and customizable features you can easily create a highimpact presentation deck that resonates with your audience. Infographic templates within the bundle enhance your data visualization making it accessible and engaging. Whether youre addressing stakeholders or pitching to potential investors this versatile collection of editable slides ensures that your corporate presentation stands out and drives strategic decisions.
-
Web Analytics Best Practices For Accurate Data Reporting PPT Sample AT
Do not compromise on a template that erodes your messages impact. Introducing our engaging Web Analytics Best Practices For Accurate Data Reporting PPT Sample AT complete deck, thoughtfully crafted to grab your audiences attention instantly. With this deck, effortlessly download and adjust elements, streamlining the customization process. Whether you are using Microsoft versions or Google Slides, it fits seamlessly into your workflow. Furthermore, it is accessible in JPG, JPEG, PNG, and PDF formats, facilitating easy sharing and editing. Not only that you also play with the color theme of your slides making it suitable as per your audiences preference.
-
Consumer Data Reporting PPT Mockup VA
Crafting a compelling consumer data reporting presentation is essential for any business aiming to make datadriven decisions. This PowerPoint mockup offers a striking visual storytelling experience with modern slide designs that effectively showcase your analytics. Dive into a professional layout tailored for both corporate presentations and pitch decks ensuring your audience engages with the insights you present. Enhanced with editable slides and dynamic infographic templates your data visualization can shine through in unique ways. Utilize this template to elevate your reporting game whether in executive discussions or strategy sessions. Capture attention and drive results with this essential presentation resource.
-
Big Data Reporting Tools Powerpoint Ppt Template Bundles
If you require a professional template with great design, then this Big Data Reporting Tools Powerpoint Ppt Template Bundles is an ideal fit for you. Deploy it to enthrall your audience and increase your presentation threshold with the right graphics, images, and structure. Portray your ideas and vision using Seventeen slides included in this complete deck. This template is suitable for expert discussion meetings presenting your views on the topic. With a variety of slides having the same thematic representation, this template can be regarded as a complete package. It employs some of the best design practices, so everything is well-structured. Not only this, it responds to all your needs and requirements by quickly adapting itself to the changes you make. This PPT slideshow is available for immediate download in PNG, JPG, and PDF formats, further enhancing its usability. Grab it by clicking the download button.
-
Data Transfer Reporting And Tracking For Accuracy PPT PowerPoint AT
Step up your game with our enchanting Data Transfer Reporting And Tracking For Accuracy PPT PowerPoint AT deck, guaranteed to leave a lasting impression on your audience. Crafted with a perfect balance of simplicity, and innovation, our deck empowers you to alter it to your specific needs. You can also change the color theme of the slide to mold it to your companys specific needs. Save time with our ready-made design, compatible with Microsoft versions and Google Slides. Additionally, its available for download in various formats including JPG, JPEG, and PNG. Outshine your competitors with our fully editable and customized deck.
-
Monitoring Reporting Data Key Metrics For Effective Business Insights PPT Sample AT
While your presentation may contain top-notch content, if it lacks visual appeal, you are not fully engaging your audience. Introducing our Monitoring Reporting Data Key Metrics For Effective Business Insights PPT Sample AT deck, designed to engage your audience. Our complete deck boasts a seamless blend of Creativity and versatility. You can effortlessly customize elements and color schemes to align with your brand identity. Save precious time with our pre-designed template, compatible with Microsoft versions and Google Slides. Plus, its downloadable in multiple formats like JPG, JPEG, and PNG. Elevate your presentations and outshine your competitors effortlessly with our visually stunning 100 percent editable deck.
-
Databricks Lakehouse Tool For Big Data Reporting
This slide showcases databricks lakehouse platform big data reporting tool. It aims to simplify process of working with all data types to focus on getting valuable business insights quickly . It includes features, benefits, user satisfaction and market industries. Presenting our well structured Databricks Lakehouse Tool For Big Data Reporting. The topics discussed in this slide are Algorithms, Teams, Software. This is an instantly available PowerPoint presentation that can be edited conveniently. Download it right away and captivate your audience.
-
Icon For IoT Big Data Reporting Tools
Presenting our set of slides with Icon For IoT Big Data Reporting Tools. This exhibits information on three stages of the process. This is an easy to edit and innovatively designed PowerPoint template. So download immediately and highlight information on Reporting, Data, Tools.
-
Checklist For Selecting Big Data Reporting Tools
This slide highlights checklist for identifying big data reporting tools. It aims to help data scientists, engineers, business users, developers during big data analytics tools evaluation and selection process. It includes items such as data exploration, wrangling and preparation, version control to document analytics models, etc. Presenting our well structured Checklist For Selecting Big Data Reporting Tools. The topics discussed in this slide are Reporting, Data, Tools. This is an instantly available PowerPoint presentation that can be edited conveniently. Download it right away and captivate your audience.
-
Big Data Reporting Tools For Digital Marketing
This slide highlights big data reporting tools for online marketing. It aims to gain a actionable insights of customer needs, market trends, and risk factors to formulate effective marketing strategies. It includes various elements such as ruler analytics, adverity, etc. Introducing our premium set of slides with Big Data Reporting Tools For Digital Marketing. Ellicudate the four stages and present information using this PPT slide. This is a completely adaptable PowerPoint template design that can be used to interpret topics like Analytics, Digital, Marketing. So download instantly and tailor it with your information.
-
ESG Data Reporting And Management Dashboard Global Green Technology And Sustainability
The following slide showcases a dashboard for tracking and managing data of economic, social and global goals. It provides information about ESG score breakdown by region, MV weight and MTD return by sector, fund vs. sector ESG score, lowest rated companies with MV weight over 1, etc. Present the topic in a bit more detail with this ESG Data Reporting And Management Dashboard Global Green Technology And Sustainability Use it as a tool for discussion and navigation on Score Breakdown By Region, Return By Sector This template is free to edit as deemed fit for your organization. Therefore download it now.
-
Business intelligence with data reporting and visualization
Presenting this set of slides with name - Business Intelligence With Data Reporting And Visualization. This is a one stage process. The stages in this process are Business Understanding, Business Intelligence, Business Knowledge.
-
Assessment process planning gathering data reporting result
Presenting this set of slides with name - Assessment Process Planning Gathering Data Reporting Result. This is a three stage process. The stages in this process are Assessment Process, Assessment Cycle, Assessment Management.
-
Visualizing Data Enhancing Tracking And Reporting Insights PPT Guidelines AT
Do not compromise on a template that erodes your messages impact. Introducing our engaging Visualizing Data Enhancing Tracking And Reporting Insights PPT Guidelines AT complete deck, thoughtfully crafted to grab your audiences attention instantly. With this deck, effortlessly download and adjust elements, streamlining the customization process. Whether you are using Microsoft versions or Google Slides, it fits seamlessly into your workflow. Furthermore, it is accessible in JPG, JPEG, PNG, and PDF formats, facilitating easy sharing and editing. Not only that you also play with the color theme of your slides making it suitable as per your audiences preference.
-
Data reporting benefit sought customer segmentation business opportunities
Presenting this set of slides with name - Data Reporting Benefit Sought Customer Segmentation Business Opportunities. This is an editable four stages graphic that deals with topics like Data Reporting, Benefit Sought, Customer Segmentation, Business Opportunities to help convey your message better graphically. This product is a premium product available for immediate download, and is 100 percent editable in Powerpoint. Download this now and use it in your presentations to impress your audience.
-
Automated data reporting ppt powerpoint presentation pictures format ideas cpb
Presenting this set of slides with name Automated Data Reporting Ppt Powerpoint Presentation Pictures Format Ideas Cpb. This is an editable Powerpoint four stages graphic that deals with topics like Automated Data Reporting to help convey your message better graphically. This product is a premium product available for immediate download and is 100 percent editable in Powerpoint. Download this now and use it in your presentations to impress your audience.
-
Sla management framework with service quality and data reporting
Introducing our SLA Management Framework With Service Quality And Data Reporting set of slides. The topics discussed in these slides are Data Flow Network, Performance Manager, Key Performance Indicator. This is an immediately available PowerPoint presentation that can be conveniently customized. Download it and convince your audience.
-
Consolidated data reporting system ppt powerpoint presentation outline graphics cpb
Presenting this set of slides with name Consolidated Data Reporting System Ppt Powerpoint Presentation Outline Graphics Cpb. This is an editable Powerpoint six stages graphic that deals with topics like Consolidated Data Reporting System to help convey your message better graphically. This product is a premium product available for immediate download and is 100 percent editable in Powerpoint. Download this now and use it in your presentations to impress your audience.
-
Consolidated data reporting ppt powerpoint presentation slides deck cpb
Presenting this set of slides with name Consolidated Data Reporting Ppt Powerpoint Presentation Slides Deck Cpb. This is an editable Powerpoint five stages graphic that deals with topics like Consolidated Data Reporting to help convey your message better graphically. This product is a premium product available for immediate download and is 100 percent editable in Powerpoint. Download this now and use it in your presentations to impress your audience.
-
Monitoring Reporting Data PPT Mockup AT
Do not compromise on a template that erodes your messages impact. Introducing our engaging Monitoring Reporting Data PPT Mockup AT complete deck, thoughtfully crafted to grab your audiences attention instantly. With this deck, effortlessly download and adjust elements, streamlining the customization process. Whether you are using Microsoft versions or Google Slides, it fits seamlessly into your workflow. Furthermore, it is accessible in JPG, JPEG, PNG, and PDF formats, facilitating easy sharing and editing. Not only that you also play with the color theme of your slides making it suitable as per your audiences preference.
-
Management Reporting Financial And Operational Data Insights PPT Demonstration AT
While your presentation may contain top notch content, if it lacks visual appeal, you are not fully engaging your audience. Introducing our Management Reporting Financial And Operational Data Insights PPT Demonstration AT deck, designed to engage your audience. Our complete deck boasts a seamless blend of Creativity and versatility. You can effortlessly customize elements and color schemes to align with your brand identity. Save precious time with our pre designed template, compatible with Microsoft versions and Google Slides. Plus, its downloadable in multiple formats like JPG, JPEG, and PNG. Elevate your presentations and outshine your competitors effortlessly with our visually stunning 100 percent editable deck.
-
Data And Reporting Governance PPT Powerpoint VA
Discover the power of clarity with our data and reporting governance PowerPoint template. This meticulous presentation deck provides a structured approach perfect for conveying complex data governance strategies with ease. Crafted for professionals who prioritize accountability it features modern slide designs that seamlessly integrate visual storytelling techniques alongside practical data visualization tools. Elevate your corporate presentations with animated presentation elements that capture attention and convey vital information effectively. Each editable slide is ready to adapt to your unique narrative ensuring your audience grasps the significance of robust reporting practices. Stand out in board meetings and strategic discussions with a visually compelling and insightful presentation experience.
-
BI Reporting Data To Actionable Intelligence PPT Example AT
Do not compromise on a template that erodes your messages impact. Introducing our engaging BI Reporting Data To Actionable Intelligence PPT Example AT complete deck, thoughtfully crafted to grab your audiences attention instantly. With this deck, effortlessly download and adjust elements, streamlining the customization process. Whether you are using Microsoft versions or Google Slides, it fits seamlessly into your workflow. Furthermore, it is accessible in JPG, JPEG, PNG, and PDF formats, facilitating easy sharing and editing. Not only that you also play with the color theme of your slides making it suitable as per your audiences preference.
-
Challenges And Solutions In Monitoring And Reporting Data Management PPT Example AT
While your presentation may contain top-notch content, if it lacks visual appeal, you are not fully engaging your audience. Introducing our Challenges And Solutions In Monitoring And Reporting Data Management PPT Example AT deck, designed to engage your audience. Our complete deck boasts a seamless blend of Creativity and versatility. You can effortlessly customize elements and color schemes to align with your brand identity. Save precious time with our pre-designed template, compatible with Microsoft versions and Google Slides. Plus, its downloadable in multiple formats like JPG, JPEG, and PNG. Elevate your presentations and outshine your competitors effortlessly with our visually stunning 100 percent editable deck.
-
Data Provenance Reporting PPT Outline AT
Ditch the Dull templates and opt for our engaging Data Provenance Reporting PPT Outline AT deck to attract your audience. Our visually striking design effortlessly combines creativity with functionality, ensuring your content shines through. Compatible with Microsoft versions and Google Slides, it offers seamless integration of presentation. Save time and effort with our pre-designed PPT layout, while still having the freedom to customize fonts, colors, and everything you ask for. With the ability to download in various formats like JPG, JPEG, and PNG, sharing your slides has never been easier. From boardroom meetings to client pitches, this deck can be the secret weapon to leaving a lasting impression.
-
Mastering ESG Reporting And Data Challenges Successfully PPT Summary AT
Step up your game with our enchanting Mastering ESG Reporting And Data Challenges Successfully PPT Summary AT deck, guaranteed to leave a lasting impression on your audience. Crafted with a perfect balance of simplicity, and innovation, our deck empowers you to alter it to your specific needs. You can also change the color theme of the slide to mold it to your companys specific needs. Save time with our ready-made design, compatible with Microsoft versions and Google Slides. Additionally, its available for download in various formats including JPG, JPEG, and PNG. Outshine your competitors with our fully editable and customized deck.
-
Free For Data Analysis And Reporting PPT PowerPoint AT
Step up your game with our enchanting Free For Data Analysis And Reporting PPT PowerPoint AT deck, guaranteed to leave a lasting impression on your audience. Crafted with a perfect balance of simplicity, and innovation, our deck empowers you to alter it to your specific needs. You can also change the color theme of the slide to mold it to your companys specific needs. Save time with our ready-made design, compatible with Microsoft versions and Google Slides. Additionally, its available for download in various formats including JPG, JPEG, and PNG. Outshine your competitors with our fully editable and customized deck.
-
Data Visualization And Reporting A Deep Dive Into Splunk Dashboards PPT Example ST AI
While your presentation may contain top-notch content, if it lacks visual appeal, you are not fully engaging your audience. Introducing our Data Visualization And Reporting A Deep Dive Into Splunk Dashboards PPT Example ST AI deck, designed to engage your audience. Our complete deck boasts a seamless blend of Creativity and versatility. You can effortlessly customize elements and color schemes to align with your brand identity. Save precious time with our pre-designed template, compatible with Microsoft versions and Google Slides. Plus, its downloadable in multiple formats like JPG, JPEG, and PNG. Elevate your presentations and outshine your competitors effortlessly with our visually stunning 100 percent editable deck.
-
Data Driven Reporting From Metrics To Insights PPT Slides AT
Dive into the world of Data Driven Reporting From Metrics To Insights PPT Slides, where your data transforms into compelling narratives. These meticulously crafted presentation graphics empower you to convey complex metrics with clarity and impact. Engage your audience with modern slide designs that seamlessly integrate data visualization techniques, making insights not just understandable but memorable. Perfect for corporate presentations or consulting pitches, this collection of editable slides offers a dynamic approach to storytelling through data. Elevate your strategy deck with creative layouts that captivate and inform, ensuring your insights resonate long after the presentation ends.
-
Revenue Breakup Insights From Segment Wise Reporting Data PPT Template AT
Step up your game with our enchanting Revenue Breakup Insights From Segment Wise Reporting Data PPT Template AT deck, guaranteed to leave a lasting impression on your audience. Crafted with a perfect balance of simplicity, and innovation, our deck empowers you to alter it to your specific needs. You can also change the color theme of the slide to mold it to your companys specific needs. Save time with our ready-made design, compatible with Microsoft versions and Google Slides. Additionally, its available for download in various formats including JPG, JPEG, and PNG. Outshine your competitors with our fully editable and customized deck.
-
Monitoring Reporting Data Tools PPT Summary AT
Do not compromise on a template that erodes your messages impact. Introducing our engaging Monitoring Reporting Data Tools PPT Summary AT complete deck, thoughtfully crafted to grab your audiences attention instantly. With this deck, effortlessly download and adjust elements, streamlining the customization process. Whether you are using Microsoft versions or Google Slides, it fits seamlessly into your workflow. Furthermore, it is accessible in JPG, JPEG, PNG, and PDF formats, facilitating easy sharing and editing. Not only that you also play with the color theme of your slides making it suitable as per your audiences preference.
-
Tools Virtual Assistants Use For Data Management Reporting PPT Slides AT
Do not compromise on a template that erodes your messages impact. Introducing our engaging Tools Virtual Assistants Use For Data Management Reporting PPT Slides AT complete deck, thoughtfully crafted to grab your audiences attention instantly. With this deck, effortlessly download and adjust elements, streamlining the customization process. Whether you are using Microsoft versions or Google Slides, it fits seamlessly into your workflow. Furthermore, it is accessible in JPG, JPEG, PNG, and PDF formats, facilitating easy sharing and editing. Not only that you also play with the color theme of your slides making it suitable as per your audiences preference.
-
Financial Reporting Data Analysis Monotone Icon In Powerpoint Pptx Png And Editable Eps Format
This Monotone powerpoint icon is the perfect addition to your E accounting presentation. With its sleek and modern design, it will enhance the visual appeal of your slides and make your presentation stand out. The icon is specifically designed for E accounting and will add a professional touch to your slides.
-
Financial Reporting Data Analysis Colored Icon In Powerpoint Pptx Png And Editable Eps Format
This colourful PowerPoint icon is perfect for presentations on E accounting. Featuring a modern design and vibrant colours, it will add a professional touch to your slides. Use it to showcase financial data, accounting software, or any other related topics. Enhance your E accounting presentations with this eye catching icon.
-
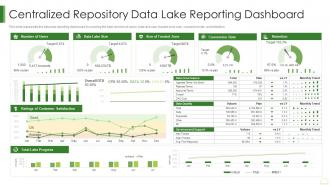
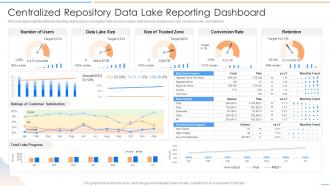
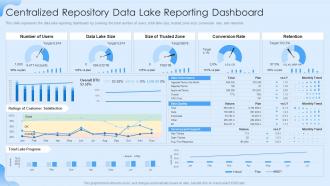
Data Lake It Centralized Repository Data Lake Reporting Dashboard Snapshot
This slide represents the data lake reporting dashboard by covering the total number of users, total lake size, trusted zone size, conversion rate, and retention. Present the topic in a bit more detail with this Data Lake It Centralized Repository Data Lake Reporting Dashboard Snapshot. Use it as a tool for discussion and navigation on Centralized, Repository, Dashboard. This template is free to edit as deemed fit for your organization. Therefore download it now.
-
Data Visualization Principles For Clear Reporting PPT PowerPoint AT
While your presentation may contain top-notch content, if it lacks visual appeal, you are not fully engaging your audience. Introducing our Data Visualization Principles For Clear Reporting PPT PowerPoint AT deck, designed to engage your audience. Our complete deck boasts a seamless blend of Creativity and versatility. You can effortlessly customize elements and color schemes to align with your brand identity. Save precious time with our pre-designed template, compatible with Microsoft versions and Google Slides. Plus, its downloadable in multiple formats like JPG, JPEG, and PNG. Elevate your presentations and outshine your competitors effortlessly with our visually stunning 100 percent editable deck.
-
ESG Sustainability Reporting And Data Challenges PPT Mockup AT
Do not compromise on a template that erodes your messages impact. Introducing our engaging ESG Sustainability Reporting And Data Challenges PPT Mockup AT complete deck, thoughtfully crafted to grab your audiences attention instantly. With this deck, effortlessly download and adjust elements, streamlining the customization process. Whether you are using Microsoft versions or Google Slides, it fits seamlessly into your workflow. Furthermore, it is accessible in JPG, JPEG, PNG, and PDF formats, facilitating easy sharing and editing. Not only that you also play with the color theme of your slides making it suitable as per your audiences preference.
-
Data Lake Formation With AWS Cloud Centralized Repository Data Lake Reporting Dashboard
This slide represents the data lake reporting dashboard by covering the total number of users, total lake size, trusted zone size, conversion rate, and retention. Deliver an outstanding presentation on the topic using this Data Lake Formation With AWS Cloud Centralized Repository Data Lake Reporting Dashboard. Dispense information and present a thorough explanation of Centralized Repository, Data Lake Reporting, Dashboard using the slides given. This template can be altered and personalized to fit your needs. It is also available for immediate download. So grab it now.
-
Marketing Analytics With Data Feeds Tracking Attribution And Reporting PPT Sample AT
Step up your game with our enchanting Marketing Analytics With Data Feeds Tracking Attribution And Reporting PPT Sample AT deck, guaranteed to leave a lasting impression on your audience. Crafted with a perfect balance of simplicity, and innovation, our deck empowers you to alter it to your specific needs. You can also change the color theme of the slide to mold it to your companys specific needs. Save time with our ready made design, compatible with Microsoft versions and Google Slides. Additionally, its available for download in various formats including JPG, JPEG, and PNG. Outshine your competitors with our fully editable and customized deck.
-
Data Lake Future Of Analytics Centralized Repository Data Lake Reporting Dashboard Ppt Tips
This slide represents the data lake reporting dashboard by covering the total number of users, total lake size, trusted zone size, conversion rate, and retention. Present the topic in a bit more detail with this Data Lake Future Of Analytics Centralized Repository Data Lake Reporting Dashboard Ppt Tips. Use it as a tool for discussion and navigation on Centralized Repository, Reporting Dashboard. This template is free to edit as deemed fit for your organization. Therefore download it now.
-
Live Data Analysis And Reporting With SAP Analytics Cloud PPT Example AT
Do not compromise on a template that erodes your messages impact. Introducing our engaging Live Data Analysis And Reporting With SAP Analytics Cloud PPT Example AT complete deck, thoughtfully crafted to grab your audiences attention instantly. With this deck, effortlessly download and adjust elements, streamlining the customization process. Whether you are using Microsoft versions or Google Slides, it fits seamlessly into your workflow. Furthermore, it is accessible in JPG, JPEG, PNG, and PDF formats, facilitating easy sharing and editing. Not only that you also play with the color theme of your slides making it suitable as per your audiences preference.
-
Data Lake Formation Centralized Repository Data Lake Reporting Dashboard
This slide represents the data lake reporting dashboard by covering the total number of users, total lake size, trusted zone size, conversion rate, and retention. Deliver an outstanding presentation on the topic using this Data Lake Formation Centralized Repository Data Lake Reporting Dashboard. Dispense information and present a thorough explanation of Data Lake Size, Conversion Rate, Retention using the slides given. This template can be altered and personalized to fit your needs. It is also available for immediate download. So grab it now.
-
Centralized Repository Data Lake Reporting Data Lake Architecture And The Future Of Log Analytics
This slide represents the data lake reporting dashboard by covering the total number of users, total lake size, trusted zone size, conversion rate, and retention. Present the topic in a bit more detail with this Centralized Repository Data Lake Reporting Data Lake Architecture And The Future Of Log Analytics. Use it as a tool for discussion and navigation on Lake Progress, Ratings Of Customer Satisfaction, Retention. This template is free to edit as deemed fit for your organization. Therefore download it now.
-
Data Lake Formation With Hadoop Cluster Centralized Repository Data Lake Reporting Dashboard
This slide represents the data lake reporting dashboard by covering the total number of users, total lake size, trusted zone size, conversion rate, and retention. Present the topic in a bit more detail with this Data Lake Formation With Hadoop Cluster Centralized Repository Data Lake Reporting Dashboard. Use it as a tool for discussion and navigation on Total Lake Progress, Overall DTU, Conversion Rate, Retention. This template is free to edit as deemed fit for your organization. Therefore download it now.
-
Building Effective Data Organization And Reporting Structures PPT Graphics AT
Step up your game with our enchanting Building Effective Data Organization And Reporting Structures PPT Graphics AT deck, guaranteed to leave a lasting impression on your audience. Crafted with a perfect balance of simplicity, and innovation, our deck empowers you to alter it to your specific needs. You can also change the color theme of the slide to mold it to your companys specific needs. Save time with our ready made design, compatible with Microsoft versions and Google Slides. Additionally, its available for download in various formats including JPG, JPEG, and PNG. Outshine your competitors with our fully editable and customized deck.
-
Data Analysis Reporting Monotone Icon In Powerpoint Pptx Png And Editable Eps Format
This Monotone PowerPoint Icon is perfect for representing Reporting in presentations. It features a graph-like image with a document and a magnifying glass, providing a modern and professional look. It is easy to use and can be used to enhance any presentation.
-
Cube Reporting Data Visualization Monotone Icon In Powerpoint Pptx Png And Editable Eps Format
This Monotone powerpoint icon is perfect for adding a modern touch to your presentations. It features a simple, clean design and is sure to make your slides stand out. It is easy to customize and will add a professional look to any presentation.
-
Data quality reporting metrics ppt powerpoint presentation infographics vector cpb
Presenting our Data Quality Reporting Metrics Ppt Powerpoint Presentation Infographics Vector Cpb PowerPoint template design. This PowerPoint slide showcases four stages. It is useful to share insightful information on Data Quality Reporting Metrics This PPT slide can be easily accessed in standard screen and widescreen aspect ratios. It is also available in various formats like PDF, PNG, and JPG. Not only this, the PowerPoint slideshow is completely editable and you can effortlessly modify the font size, font type, and shapes according to your wish. Our PPT layout is compatible with Google Slides as well, so download and edit it as per your knowledge.
-
Water Quality Data Analysis And Reporting PPT Summary AT
Ditch the Dull templates and opt for our engaging Water Quality Data Analysis And Reporting PPT Summary AT deck to attract your audience. Our visually striking design effortlessly combines creativity with functionality, ensuring your content shines through. Compatible with Microsoft versions and Google Slides, it offers seamless integration of presentation. Save time and effort with our pre-designed PPT layout, while still having the freedom to customize fonts, colors, and everything you ask for. With the ability to download in various formats like JPG, JPEG, and PNG, sharing your slides has never been easier. From boardroom meetings to client pitches, this deck can be the secret weapon to leaving a lasting impression.
-
Factors To Consider In Fleet Data Management Reporting
This slide showcases data for reporting fleet management. This template focuses on tracking and measuring correct data to run successful fleet in organization. It includes information related to maintenance records, safety information, etc.Presenting our set of slides with Factors To Consider In Fleet Data Management Reporting. This exhibits information on five stages of the process. This is an easy to edit and innovatively designed PowerPoint template. So download immediately and highlight information on Maintenance Records, Asset Tracking Documentation, Fleet Management.
-
Data Collection Plan Sampling Analysis And Reporting Techniques PPT Summary AT
Step up your game with our enchanting Data Collection Plan Sampling Analysis And Reporting Techniques PPT Summary AT deck, guaranteed to leave a lasting impression on your audience. Crafted with a perfect balance of simplicity, and innovation, our deck empowers you to alter it to your specific needs. You can also change the color theme of the slide to mold it to your companys specific needs. Save time with our ready made design, compatible with Microsoft versions and Google Slides. Additionally, its available for download in various formats including JPG, JPEG, and PNG. Outshine your competitors with our fully editable and customized deck.
-
Data warehousing reporting analytics data mining
Presenting this set of slides with name - Data Warehousing Reporting Analytics Data Mining. This is a two stage process. The stages in this process are Etl, Extract, Transform And Load, Data Warehousing.