

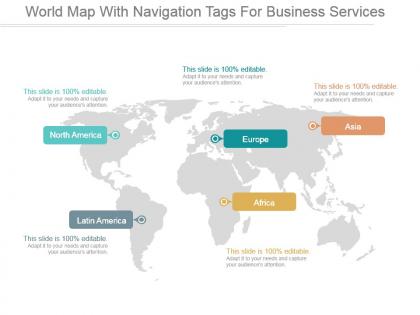
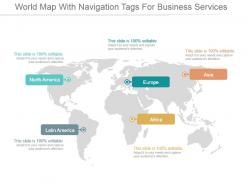
World map with navigation tags for business services ppt slide styles




Try Before you Buy Download Free Sample Product
 Impress Your
 Audience
 100%
100% Editable
 Save Hours
 of Time


Discard impractical ideas clogging your brain with our World Map With Navigation Tags For Business Services Ppt Slide Styles. It will clear the jam.
People who downloaded this PowerPoint presentation also viewed the following :
World map with navigation tags for business services ppt slide styles with all 5 slides:
Extract the advantage from any break with our World Map With Navigation Tags For Business Services Ppt Slide Styles. Gain from intervals.
FAQs for World map with navigation tags for business services
Key elements include geographic service coverage, regional market data, service delivery locations, client distribution patterns, and operational hubs with performance metrics. These components enhance stakeholder understanding by visualizing global reach, identifying growth opportunities, and demonstrating competitive positioning across markets, with many organizations finding that comprehensive geographic presentations ultimately strengthen investor confidence and strategic planning initiatives.
Visual storytelling transforms world map business services presentations by incorporating data visualization, geographic flow charts, color-coded regional insights, and progressive disclosure techniques that guide audience attention strategically. These approaches enable organizations to communicate global expansion plans, service distribution networks, and market penetration strategies more effectively, with many companies finding that visual narratives significantly increase stakeholder engagement and decision-making clarity.
**INPUT**: What design principles should be considered when creating a world map business services presentation? **OUTPUT**: Key design principles include visual hierarchy, color consistency, clear data representation, strategic typography, and balanced white space usage. These elements enhance audience comprehension by highlighting geographic service coverage, streamlining complex information flow, and maintaining professional aesthetics, with many organizations finding that strategic color coding and scalable graphics ultimately deliver more impactful stakeholder communications. *[Word count: 54 words]*
Companies can effectively showcase global reach by highlighting office locations, market presence, client distribution, revenue streams, and expansion timelines across different regions on their world map presentations. Through strategic color coding, interactive elements, and data visualization overlays, organizations streamline complex geographical information while demonstrating market penetration, ultimately delivering compelling evidence of international scale and competitive positioning to stakeholders.
Creative data visualization techniques for world map business services presentations include heat mapping for regional performance metrics, interactive clickable regions with drill-down capabilities, animated flow charts showing service delivery pathways, layered infographics combining geographic and statistical data, and dynamic timeline overlays. These approaches enhance audience engagement by transforming static geographical information into compelling visual narratives, while enabling stakeholders to quickly identify market opportunities, service gaps, and performance trends across different regions, ultimately delivering clearer strategic insights.
Businesses can tailor world map presentations by adapting color schemes, iconography, data emphasis, and regional focus to align with cultural preferences and business contexts. Strategic customization includes highlighting relevant geographic markets, using culturally appropriate visual elements, and emphasizing regional success stories, ultimately delivering more engaging presentations that resonate with diverse stakeholders and enhance cross-cultural communication effectiveness.
Color coding enhances world map business services presentations by categorizing service types, indicating performance levels, showing regional availability, and highlighting market penetration across different territories. This visual strategy enables organizations to quickly identify expansion opportunities, resource allocation needs, and service gaps, while stakeholders can immediately grasp global operations scope, ultimately streamlining strategic decision-making and competitive positioning efforts.
Animation and transitions enhance world map business services presentations by highlighting geographic expansion, revealing market penetration data progressively, and creating smooth connections between global locations and service offerings. Strategic animations like fade-ins for regional markets, path animations for service delivery routes, and timed data reveals help audiences follow complex international operations, ultimately delivering clearer storytelling and improved stakeholder engagement across diverse business territories.
Geographically segmented data in world map presentations enhances strategic decision-making by providing visual clarity, identifying market opportunities, optimizing resource allocation, and revealing regional performance patterns. Through interactive mapping technologies, businesses streamline global expansion planning, enhance investor communications, and deliver compelling stakeholder presentations, with many multinational organizations finding that geographic visualization significantly accelerates market entry strategies and competitive positioning.
Typography significantly impacts world map business services presentations by enhancing readability, establishing visual hierarchy, and reinforcing professional credibility across global content. Strategic font choices streamline information processing, with sans-serif fonts improving clarity for international audiences, while consistent sizing and spacing guide viewers through complex geographical data, ultimately delivering more engaging presentations and stronger stakeholder comprehension.
**INPUT**: What software tools are recommended for creating high-quality world map business services presentations? **OUTPUT**: Recommended software tools include Microsoft PowerPoint, Prezi, Canva, Adobe Creative Suite, and Tableau for creating professional world map business presentations. These platforms streamline global service visualization by offering customizable templates, interactive mapping features, and data integration capabilities, with many organizations finding that strategic combinations of these tools ultimately deliver enhanced client presentations and competitive advantage.
Presenters can effectively communicate complex information through world map slides by using color coding for data visualization, strategic placement of callouts and annotations, layered information delivery, and interactive elements that guide audience attention. These visual storytelling techniques enable businesses to showcase global operations, market penetration, and regional performance data seamlessly, ultimately delivering clearer insights and more engaging presentations.
Case studies include McKinsey's global market expansion presentations for retail clients, Deloitte's international supply chain optimization reports for manufacturing firms, and PwC's multi-regional risk assessment frameworks for financial services. These presentations streamline complex geographical data, enhance stakeholder understanding of global operations, and ultimately deliver clearer strategic insights, with many consulting firms finding that visual mapping accelerates client decision-making processes.
A world map presentation maintains engagement through progressive disclosure, starting with global overview before drilling into specific regions, interactive elements like clickable hotspots, storytelling that connects geographic data to business outcomes, and strategic use of animations to reveal information sequentially. This approach enables presenters to build compelling narratives around market expansion, regional performance, and global opportunities, with many organizations finding that geographically-structured presentations enhance comprehension and strategic decision-making.
Integrating case studies enhances credibility by providing concrete evidence of successful global implementations, demonstrating measurable outcomes across different markets, and showcasing real client testimonials from various geographic regions. These authentic examples help audiences visualize practical applications, reduce skepticism about international scalability, and build trust through documented results, with many organizations finding that region-specific success stories significantly strengthen their business services proposals.
-
Visually stunning presentation, love the content.
-
Thanks for all your great templates they have saved me lots of time and accelerate my presentations. Great product, keep them up!