


0314 business ppt diagram 3d cone staircase business diagram 5 steps powerpoint template




Try Before you Buy Download Free Sample Product
 Impress Your
 Audience
 100%
100% Editable
 Save Hours
 of Time


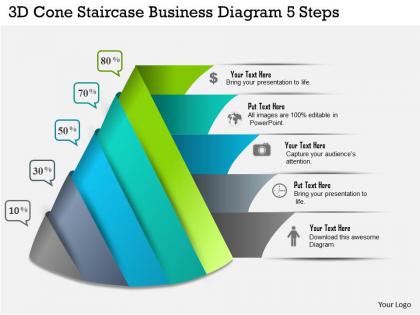
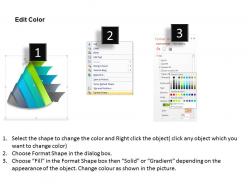
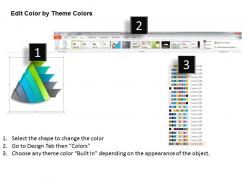
A business success can be accomplished if it has been planned in the systematic manner. This 3D cone staircase business diagram five steps PowerPoint template has been crafted to show the development process in the corporate. The presentation cone designed in the creative manner to show innovation which is must in today’s business environment. This is a five steps process PPT image with elegant and colorful graphics in which the designers has provided free space to enter the content or the business information. Every step has varied business icon which differentiate the business sectors and convey the message in the effective way. This five steps process business PowerPoint template can be used for a business and marketing presentations while allowing the presenters to create an impact that is ever lasting. This professional business growth PowerPoint design useful as it is downloadable with percentage values which allows to even use it for finance and data representation related topics as well. Download it now. Irrespective of the concept that you are trying to demonstrate no matter how abstract you think it is our 0314 Business Ppt Diagram 3D Cone Staircase Business Diagram 5 Steps Powerpoint Template can help make it easier. There is a readymade slide for all fields of life.
People who downloaded this PowerPoint presentation also viewed the following :
0314 business ppt diagram 3d cone staircase business diagram 5 steps powerpoint template with all 5 slides:
Use our bewitching 0314 Business Ppt Diagram 3D Cone Staircase Business Diagram 5 Steps Powerpoint Template. They will delight your audience with the magic of your words.
FAQs for 0314 business ppt diagram 3d cone staircase business diagram 5
Key components include hierarchical levels, progressive stages, directional flow indicators, labeled step sections, and dimensional visual elements that create depth and perspective. These components work together by illustrating business processes, organizational structures, or strategic progressions in manufacturing, consulting, and project management sectors, ultimately delivering clear visual communication and enhanced stakeholder understanding of complex multi-stage business frameworks.
A 3D cone staircase model enhances visual communication by transforming linear progression into engaging spatial narratives, creating memorable hierarchical structures, and enabling audiences to visualize step-by-step processes with greater clarity and depth. This approach streamlines complex business concepts through intuitive visual flow, with many organizations finding that three-dimensional diagrams significantly improve audience retention and comprehension during strategic presentations.
Industries like consulting, technology, healthcare, financial services, and manufacturing can benefit most from 3D cone staircase business diagrams for presenting hierarchical processes, strategic roadmaps, and multi-level frameworks. These visual tools enhance client presentations, stakeholder communications, and training materials by transforming complex business concepts into engaging, easy-to-understand formats that ultimately improve decision-making and knowledge retention.
The 3D cone staircase visually represents organizational hierarchies by displaying each management level as distinct steps, clearly showing reporting relationships, departmental divisions, and authority flows from top executives down to operational staff. This diagram enables businesses to communicate complex organizational structures effectively, streamline onboarding processes, and identify potential restructuring opportunities, ultimately delivering enhanced organizational clarity and improved operational efficiency.
**INPUT**: What software tools are best suited for creating 3D cone staircase diagrams? **OUTPUT**: Leading software for 3D cone staircase diagrams includes PowerPoint, Lucidchart, Canva, Adobe Illustrator, and specialized tools like SketchUp or Blender. These platforms enable businesses to create compelling visual hierarchies for strategic presentations, with many consulting firms and corporate teams finding that well-designed 3D diagrams enhance stakeholder engagement and communication effectiveness. [Word count: 53 words]
**INPUT**: Can a 3D cone staircase diagram be effectively integrated with other visual aids in a presentation? **OUTPUT**: 3D cone staircase diagrams integrate seamlessly with complementary visual aids like flowcharts, timelines, data charts, and process maps to create comprehensive presentation narratives. This strategic combination enhances audience understanding by connecting hierarchical concepts with supporting details, while maintaining visual consistency and flow, ultimately delivering more engaging and persuasive presentations across business sectors. **Word count: 54 words**
Best practices for designing 3D cone staircase diagrams include using consistent color gradients, clear hierarchical labeling, balanced proportions, strategic white space, and progressive sizing from base to apex. These visual elements enhance comprehension by creating logical flow, emphasizing priority levels, and maintaining professional aesthetics, with many organizations finding that well-designed cone diagrams significantly improve stakeholder engagement and decision-making processes.
The 3D cone staircase perspective enhances data comprehension by creating visual hierarchy, depth perception, and intuitive flow that guides audiences through sequential information layers naturally. This dimensional approach enables viewers to grasp relationships between data points, process stages, and performance metrics more effectively, with organizations in consulting, strategic planning, and project management finding that the ascending visual structure significantly improves stakeholder engagement and decision-making clarity.
Common mistakes include overcrowding steps with excessive text, using inconsistent colors or fonts, creating unclear hierarchical relationships, neglecting proper spacing between elements, and failing to align content with business logic. These design flaws compromise visual clarity and audience comprehension, with many organizations finding that simplified layouts, strategic color coding, and logical step progression ultimately deliver more impactful presentations and enhanced stakeholder engagement.
Color coding enhances 3D cone staircase representations by improving visual hierarchy, enabling quick data categorization, distinguishing performance levels, highlighting critical paths, and facilitating audience comprehension across complex business processes. Through strategic color application, organizations streamline stakeholder communication, accelerate decision-making during presentations, and create intuitive navigation systems, ultimately delivering clearer insights and enhanced engagement in strategic planning sessions.
Each dimension of a 3D cone staircase can represent distinct business objectives, with height illustrating growth targets, width showing market expansion, and steps depicting milestone achievements or departmental goals. This strategic visualization enables organizations to align operational phases with measurable outcomes, ensuring teams understand progression pathways while maintaining focus on overarching business priorities and competitive positioning.
A 3D cone staircase business diagram can convey narratives of progressive growth stages, strategic milestone achievement, hierarchical organizational development, multi-dimensional scaling processes, and systematic capability building. These visual frameworks enable companies to illustrate their expansion journey through distinct phases, demonstrate strategic progression across departments or markets, and communicate complex growth trajectories, with many organizations finding that the ascending cone structure effectively represents sustainable, structured advancement toward strategic objectives.
3D elements in business diagrams significantly enhance audience engagement by creating visual depth, improving information retention, and making complex data more intuitive to understand. These dimensional presentations capture attention more effectively than flat designs, with many organizations finding that stakeholders spend longer analyzing 3D visualizations, ultimately leading to better comprehension and more productive strategic discussions.
3D cone staircase diagrams can create visual complexity, potential depth perception issues, reduced readability on smaller screens, and challenges in precise data comparison compared to simpler 2D formats. However, these limitations are often outweighed by their superior ability to showcase hierarchical relationships, multi-dimensional data connections, and strategic progressions, with many organizations finding enhanced audience engagement and memorable presentations.
Real-time data can be incorporated through interactive dashboard software, live API connections, automated data feeds, cloud-based presentation platforms, and dynamic visualization tools. These technologies enable presenters to display current KPIs, sales figures, and performance metrics directly within each cone level, while audiences witness live business progress, ultimately delivering more engaging presentations and data-driven decision making.
-
Understandable and informative presentation.
-
Great product with highly impressive and engaging designs.