


0614 excellent level of quality meter image graphics for powerpoint




Try Before you Buy Download Free Sample Product
 Impress Your
 Audience
 100%
100% Editable
 Save Hours
 of Time


Presenting, 0614 excellent level of quality meter image graphics for PowerPoint to help you design a clear and communicating PPT design. The use of colourful meter in the template icon pointing towards excellence clearly speaks about the quality level of work. A business user definitely needs to portray the level of quality provided in order to attract the attention of consumers or to build a brand name. And when you have got an excellent level of quality in your organization, there’s no point of missing on this element to flaunt among people. However to do that professionally and extremely well, this excellent level of quality meter image graphics PPT design can work really well. The quality supporting presentation icon is a simple to understand slide template where in viewers are sure to get impressed and involved which is ultimately the goal of this quality meter PPT icon. This presentation icon with quality meter graphic is communicative and assists well in making choices. Broaden the effect of your efforts with our 0614 Excellent Level Of Quality Meter Image Graphics for PowerPoint. They will gain a greater dimension.
People who downloaded this PowerPoint presentation also viewed the following :
Content of this Powerpoint Presentation
Description:
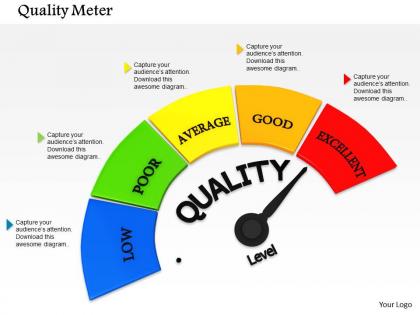
The image depicts a graphical representation known as a "Quality Meter" or gauge, which is designed to resemble the dial of a physical meter used for measuring and displaying the quality level of a product, service, or process. There are five segments in the gauge, each corresponding to a different level of quality: "Low" (blue), "Poor" (green), "Average" (yellow), "Good" (orange), and "Excellent" (red). They are arranged in an ascending order of quality from left to right.
Each segment includes placeholder text "Capture your audience's attention. Download this awesome diagram," which is meant to be replaced with specific information relevant to the user's presentation. At the center of the dial is the word "QUALITY," emphasizing the focus of the meter, and a needle points to the "Level," indicating where the current quality stands. There is also space for adding a logo at the bottom right corner, suggesting customization for business or personal branding.
Use Cases:
This type of visual is versatile and can be applied across various industries for different purposes to effectively communicate the quality status or performance:
1. Manufacturing:
Use: Assess and present the quality levels of manufactured goods
Presenter: Quality Assurance Manager
Audience: Production Team, Stakeholders
2. Healthcare:
Use: Indicate the quality of patient care or hospital services
Presenter: Hospital Administrator
Audience: Medical Staff, Board Members
3. Education:
Use: Visualize the quality of educational programs or institutions
Presenter: Educational Consultant
Audience: Educators, Policy Makers
4. Software Development:
Use: Show software quality metrics for code review outcomes
Presenter: Lead Developer or Project Manager
Audience: Development Team, Investors
5. Customer Service:
Use: Present customer satisfaction levels or service quality reviews
Presenter: Customer Service Manager
Audience: Service Team, Management
6. Food Industry:
Use: Display food quality, safety standards, or hygiene ratings
Presenter: Quality Control Inspector
Audience: Food Processing Staff, Regulatory Bodies
7. Environmental Services:
Use: Communicate the level of environmental compliance or eco-friendliness of practices
Presenter: Sustainability Officer
Audience: Environmental Agencies, Company Staff
0614 excellent level of quality meter image graphics for powerpoint with all 3 slides:
Our 0614 Excellent Level Of Quality Meter Image Graphics for PowerPoint are compulsive achievers. They will compel you to do the same.

FAQs for 0614 excellent level of quality meter image
Quality meters across industries rely on metrics including defect rates, customer satisfaction scores, process efficiency indicators, compliance percentages, and performance benchmarks. These measurements enable organizations to streamline operations, enhance product reliability, and maintain competitive advantage, with manufacturing, healthcare, and financial services finding that comprehensive quality tracking ultimately delivers reduced costs and improved customer experiences.
Organizations can effectively integrate quality meters by aligning measurement criteria with existing QMS frameworks, establishing automated data collection processes, and training teams on interpretation protocols. Through strategic integration with current workflows, companies in manufacturing, healthcare, and service industries streamline compliance monitoring, enhance real-time decision-making, and ultimately deliver improved operational efficiency while maintaining consistent quality standards across all departments.
Quality meters play a crucial role by providing real-time monitoring, standardized measurement protocols, predictive maintenance capabilities, and comprehensive data analytics that ensure consistent product performance. Through continuous quality assessment, manufacturers can identify defects early, reduce warranty claims, and maintain rigorous standards, with many organizations finding that systematic quality measurement ultimately delivers enhanced customer trust and competitive market positioning.
Digital quality meters enhance traditional quality assessment by providing real-time data collection, automated analysis, and continuous monitoring capabilities, while traditional methods rely on manual inspections and periodic evaluations. Through advanced sensors and analytics, organizations across manufacturing, healthcare, and food processing streamline quality control processes, reduce human error, and deliver faster decision-making, ultimately achieving consistent standards and operational efficiency.
Setting quality measurement thresholds requires establishing baseline metrics through historical data analysis, aligning thresholds with business objectives and customer expectations, and implementing tiered alert systems for different severity levels. Organizations should regularly review and adjust these benchmarks based on performance trends, industry standards, and operational capacity, with many finding that dynamic thresholds ultimately deliver more accurate quality assessments than static limits.
Quality meters identify improvement areas by monitoring key performance indicators, tracking defect rates, measuring process variations, and analyzing production bottlenecks in real-time. Through continuous data collection and statistical analysis, manufacturers can pinpoint inefficiencies, reduce waste, and optimize workflows, with many production facilities finding that systematic quality measurement ultimately delivers enhanced operational efficiency and competitive manufacturing advantage.
Modern quality meters are being enhanced by IoT connectivity, artificial intelligence, machine learning algorithms, wireless data transmission, and cloud-based analytics platforms. These technologies revolutionize quality control by enabling real-time monitoring, predictive maintenance capabilities, and automated data collection, with manufacturing and pharmaceutical industries finding that integrated systems deliver improved accuracy, faster decision-making, and ultimately enhanced operational efficiency.
Cultural differences significantly impact quality meter implementation through varying tolerance levels for standardization, diverse communication styles, and distinct performance expectations across regions. While Western enterprises often favor detailed metrics and individual accountability, many Asian organizations prioritize collective harmony and long-term relationships, requiring adaptable quality frameworks that balance global consistency with local cultural values, ultimately enabling more effective international operations.
Common challenges when adopting quality meters include resistance to change, data integration complexities, training requirements, initial setup costs, and establishing standardized measurement criteria. While these obstacles can seem daunting, organizations across manufacturing, healthcare, and financial services find that strategic implementation ultimately delivers enhanced operational efficiency, improved compliance tracking, and competitive advantage through data-driven quality insights.
Businesses ensure quality metrics align with strategic objectives by establishing clear performance indicators that directly connect quality outcomes to business goals, regularly reviewing metrics against strategic priorities, and involving cross-functional teams in metric development. This alignment enables organizations to track meaningful progress, optimize resource allocation, and demonstrate quality's impact on competitive advantage, with many companies finding that integrated quality frameworks ultimately enhance both operational efficiency and customer satisfaction.
Employees need technical proficiency in measurement principles, data interpretation skills, calibration procedures, and understanding of quality standards and industry regulations. Training programs should encompass hands-on equipment operation, statistical analysis fundamentals, and troubleshooting techniques, with many manufacturing and healthcare organizations finding that comprehensive certification programs ultimately enhance measurement accuracy and operational efficiency.
Visual presentations enhance quality metrics communication by transforming complex data into charts, graphs, dashboards, and infographics that enable faster comprehension and pattern recognition. These visual elements streamline decision-making processes by highlighting trends, anomalies, and performance gaps more effectively than traditional text-heavy reports, with many organizations finding that visual dashboards reduce analysis time while improving stakeholder engagement and strategic responses.
Real-time data collection significantly enhances quality meter effectiveness by enabling immediate detection of deviations, faster corrective actions, and continuous process optimization. Through instant monitoring capabilities, manufacturing facilities, pharmaceutical companies, and food processing plants can minimize defects, reduce waste, and maintain consistent product standards, ultimately delivering improved operational efficiency and competitive advantage in quality-sensitive markets.
Quality meter data drives innovation by identifying performance gaps, revealing customer pain points, and highlighting improvement opportunities across products and processes. This data enables companies to prioritize R&D investments, develop targeted solutions, and create competitive advantages, with many organizations finding that systematic quality analysis accelerates breakthrough innovations and market differentiation.
Consumer feedback plays a crucial role in calibrating quality meters by providing real-world validation data, identifying measurement gaps, revealing usage patterns, and highlighting performance discrepancies across different conditions. This feedback enables organizations to refine their quality parameters, adjust measurement thresholds, and enhance accuracy, with many companies finding that customer insights significantly improve product reliability and market responsiveness.
-
Helpful product design for delivering presentation.
-
Content of slide is easy to understand and edit.