


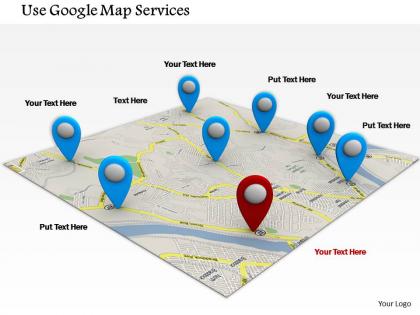
0714 use google map services diagram image graphics for powerpoint




Try Before you Buy Download Free Sample Product
 Impress Your
 Audience
 100%
100% Editable
 Save Hours
 of Time


Do you want to explain the concept of map reading? Then you should use our 0714 use Google map services diagram image graphics for PowerPoint design which will help you in describing the concept of Google maps in details. You can use this PPT design to even describe the various advantages of using Google map services for the growth and progress of your business as it helps your customers to find your locations easily, helps your business to be competitive, you can market your products or services through this service, helps your potential customers to know about your business through the reviews and etc. Whereas explain the features of this service with this PPT slide such as it helps in providing directions towards your destination, you can customize maps according to your need, provides the additional information about the place , easily accessible over internet and very reliable too. Therefore just download and start working over this PowerPoint template. Attain great fame with our 0714 Use Google Map Services Diagram Image Graphics For Powerpoint. You will get hailed among the best.
People who downloaded this PowerPoint presentation also viewed the following :
0714 use google map services diagram image graphics for powerpoint with all 3 slides:
Being elegant is in your DNA. Hold your own with our 0714 Use Google Map Services Diagram Image Graphics For Powerpoint.

FAQs for 0714 use google map services diagram image
Google Maps offers satellite imagery, street view integration, custom markers, route visualization, and terrain overlays that transform static presentations into dynamic visual experiences. These features enable presenters to showcase real locations, demonstrate geographic relationships, and illustrate market reach or expansion plans, with many businesses finding that interactive map elements significantly enhance audience engagement and make complex geographic data more accessible and compelling.
Google Maps integrates into PowerPoint presentations through screenshot insertions, embedded web objects, hyperlinked map locations, custom overlays with data points, and interactive navigation elements. These integration methods enhance business presentations by providing visual context for market analysis, sales territories, and location-based strategies, with many organizations finding that geographic visualization significantly improves stakeholder comprehension and decision-making processes.
Google Maps graphics in business presentations enhance location-based storytelling, improve audience comprehension of geographic data, provide visual context for market analysis, and create professional-looking territorial displays. These visual elements streamline complex geographical information by making data more digestible, supporting strategic planning discussions, and enabling clearer communication of regional performance, with many organizations finding that map-based presentations significantly boost stakeholder engagement and decision-making efficiency.
Google Maps services support geographical data visualization through interactive mapping APIs, custom marker systems, heat map overlays, route optimization displays, and real-time location tracking interfaces. These visualization tools enable businesses across logistics, retail, and urban planning to transform complex geographical datasets into actionable insights, ultimately delivering enhanced decision-making capabilities and improved operational efficiency.
Google Maps PowerPoint templates include location markers, route planning slides, interactive map overlays, GPS navigation graphics, and customizable pin designs. These templates streamline business presentations by enabling sales territory mapping, delivery route visualization, and customer location analysis, with many organizations finding that visual map integration enhances strategic planning and geographical data communication.
Location data transforms presentations by providing geographic context, visual anchors, and spatial relationships that make abstract concepts tangible and memorable. Through interactive maps, demographic overlays, and regional comparisons, presenters can illustrate market penetration, customer distribution, and operational reach, while enabling audiences to visualize growth opportunities and strategic expansion plans with immediate geographic relevance.
**INPUT**: What tools or techniques can be used to customize Google Maps images for PowerPoint? **OUTPUT**: Customization tools include Google My Maps for personalized overlays, screenshot editing software like Snip & Sketch or Photoshop, PowerPoint's built-in image editing features, and third-party mapping platforms like Mapbox or ArcGIS Online. These approaches enable businesses to highlight specific locations, add branded elements, and create professional route visualizations, with many organizations finding that customized maps significantly enhance audience engagement and presentation impact. **Word count: 60**
Different Google Maps views create distinct visual impacts, with street view offering detailed navigation context, satellite view providing geographic perspective, and terrain view highlighting topographical features and elevation changes. These varying perspectives enable presenters to match visual complexity with audience needs, enhance storytelling through appropriate spatial context, and deliver more targeted geographic insights, ultimately creating more engaging and purposeful location-based presentations.
When using Google Maps graphics, copyright considerations include adhering to Google's Terms of Service, maintaining required attribution notices, avoiding modifications that violate usage policies, and ensuring compliance with data licensing restrictions. These requirements help organizations navigate intellectual property boundaries while leveraging mapping visuals for presentations, with many businesses finding that proper attribution and adherence to usage guidelines enables effective geographic storytelling without legal complications.
Google Maps can illustrate market penetration, competitor locations, demographic distribution, customer density patterns, and geographic expansion opportunities through visual overlays and data integration. By incorporating location-based analytics into presentations, businesses can demonstrate territorial gaps, optimize resource allocation, and showcase growth strategies to stakeholders, ultimately delivering clearer market insights and more compelling strategic narratives.
Best practices for incorporating interactive Google Maps into PowerPoint include using high-resolution screenshots, embedding live maps through web viewers, creating clickable hotspots, maintaining consistent visual styling, and ensuring mobile compatibility. These approaches enhance presentations by delivering dynamic location context, streamlined navigation between geographic data points, and engaging audience interactions, with many organizations finding that interactive mapping significantly improves stakeholder comprehension and decision-making processes.
Audience demographics significantly influence Google Maps presentation strategies, with technical audiences preferring detailed location analytics and data overlays, while executive audiences favor simplified regional overviews and market expansion visualizations. Retail presentations emphasize store locations and customer catchment areas, healthcare focuses on service coverage zones, and logistics highlights distribution networks, with presenters increasingly customizing map complexity and visual emphasis to match their audience's expertise level and decision-making priorities.
Alternative mapping services that complement Google Maps graphics include OpenStreetMap, Mapbox, HERE Maps, ArcGIS Online, and Bing Maps, each offering unique visualization styles and specialized data layers. These platforms enhance presentation versatility by providing different aesthetic options, industry-specific overlays, and customizable features, with many organizations finding that strategic combinations deliver more comprehensive geographic storytelling and audience engagement.
Google Maps enhances logistics visualization by displaying real-time tracking, route optimization, delivery schedules, warehouse locations, and supply chain networks through interactive mapping interfaces. These visual tools streamline operations by enabling better route planning, reducing transportation costs, and improving delivery transparency, with many logistics companies finding that geographic visualization ultimately delivers enhanced operational efficiency and customer satisfaction.
Emerging trends in mapping graphics include interactive heat maps, real-time data integration, augmented reality overlays, dynamic route visualization, and 3D geographic modeling. These innovations streamline presentations by enabling live demographic analysis, seamless location-based storytelling, and enhanced audience engagement, with many organizations finding that interactive mapping graphics deliver significantly more compelling presentations and strategic insights.
-
Best way of representation of the topic.
-
Designs have enough space to add content.