


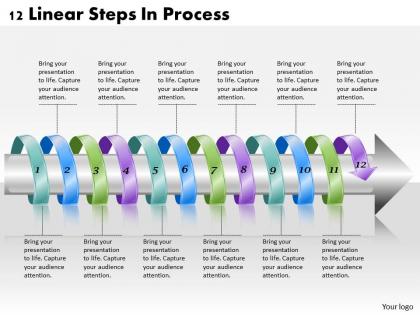
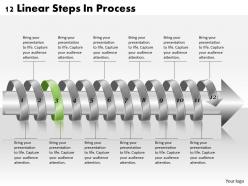
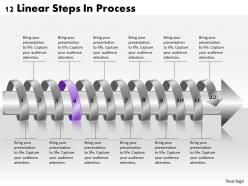
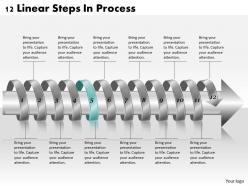
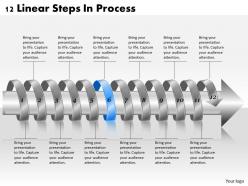
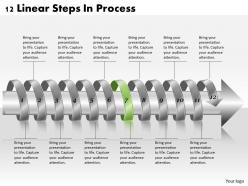
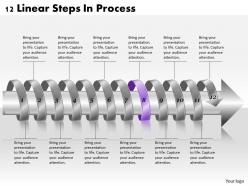
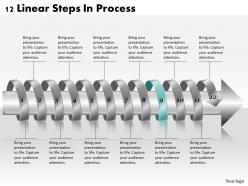
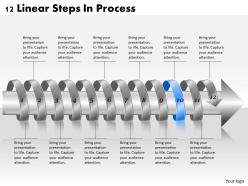
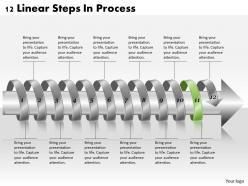
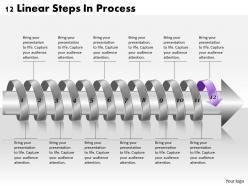
1813 business ppt diagram 12 linear steps in process powerpoint template




Try Before you Buy Download Free Sample Product
 Impress Your
 Audience
 100%
100% Editable
 Save Hours
 of Time


Commence correctly with our 1813 Business Ppt diagram 12 Linear Steps In Process Powerpoint Template. They allow you a functional edge.
People who downloaded this PowerPoint presentation also viewed the following :
1813 business ppt diagram 12 linear steps in process powerpoint template with all 17 slides:
Present your ideas to your audience in a clear and consistent manner. Make use of our 1813 Business Ppt diagram 12 Linear Steps In Process Powerpoint Template to create presentations that leave lasting impressions.
FAQs for 1813 business ppt diagram 12 linear steps in
The 1813 business PPT diagram template features 12 sequential linear steps, customizable text placeholders, professional color schemes, editable graphics, and scalable vector elements. This structured format enables organizations to clearly communicate complex processes, project timelines, and workflow sequences, with many businesses finding that visual step-by-step presentations enhance stakeholder understanding and streamline decision-making processes.
The 12 linear steps effectively represent business processes by providing clear sequential flow, defined milestones, accountability checkpoints, progress tracking mechanisms, and stakeholder alignment points throughout complex workflows. This structured approach enables organizations to visualize operational procedures, identify bottlenecks, streamline decision-making processes, and enhance team coordination, with many businesses finding that linear process mapping ultimately delivers improved efficiency and reduced implementation timelines.
Linear steps diagrams prove most beneficial in project management workflows, standard operating procedures, compliance processes, employee onboarding sequences, and product development cycles. These visual tools streamline complex procedures by breaking them into manageable phases, with organizations in manufacturing, healthcare, and financial services finding that structured step-by-step presentations enhance team alignment, reduce errors, and accelerate decision-making across departments.
The 1813 business PowerPoint template offers extensive customization options including color scheme modifications, font adjustments, text editing, shape resizing, and element repositioning to match brand guidelines. These flexible design features enable organizations across industries like consulting, manufacturing, and project management to tailor the 12-step process flow for specific workflows, ultimately delivering professional presentations that enhance stakeholder communication and strategic clarity.
Visual diagrams enhance audience understanding by transforming complex information into digestible formats, improving retention through dual coding of verbal and visual elements, and enabling faster pattern recognition. Through strategic use of flowcharts, process maps, and infographics, presenters streamline communication, reduce cognitive load, and maintain engagement, with many organizations finding that visual presentations deliver 43% higher persuasion rates and significantly improved comprehension across diverse audiences.
Industries that benefit from linear process diagrams include manufacturing, healthcare, financial services, software development, and logistics, where sequential workflows and standardized procedures are critical. These diagrams streamline operations by enhancing process visibility, reducing errors, and improving compliance tracking, with many organizations finding that clear visual workflows ultimately deliver faster execution and better quality control.
Yes, the 12 linear steps can be effectively adapted for project management presentations by representing phases like initiation, planning, execution, monitoring, and closure, along with key milestones and deliverables. This template enables project managers to visualize complex workflows, track progress systematically, and communicate timelines to stakeholders, while providing clear accountability structures that enhance team coordination and ultimately deliver better project outcomes.
**INPUT**: What best practices should be considered when presenting a linear steps process to ensure clarity? **OUTPUT**: Best practices include using consistent visual formatting, clear sequential numbering, concise step descriptions, logical flow indicators, and strategic use of colors or icons for differentiation. These approaches enhance audience comprehension by minimizing cognitive load, creating visual hierarchy, and enabling quick reference, with many organizations finding that well-structured linear presentations significantly improve stakeholder understanding and decision-making speed.
The 1813 template's color scheme strategically influences audience perception by creating visual hierarchy, enhancing information retention, and maintaining professional credibility throughout presentations. These carefully selected colors guide attention, reduce cognitive load, and establish emotional connections, with many organizations finding that consistent, purposeful color choices significantly improve audience engagement, comprehension rates, and overall presentation effectiveness.
Common mistakes include overcrowding slides with excessive text, using inconsistent formatting across steps, choosing poor color contrast that reduces readability, and failing to maintain logical flow between sequential elements. Many presenters also neglect to align their diagrams properly or use overly complex designs that distract from key messages, ultimately compromising audience engagement and comprehension during critical business presentations.
The 12 steps can be linked to specific business objectives by aligning each step with measurable outcomes, strategic milestones, and departmental goals that directly support your organization's priorities. This approach transforms abstract processes into concrete action plans, with many businesses finding that mapping steps to objectives like revenue growth, cost reduction, or market expansion creates clearer accountability and enhances stakeholder buy-in across teams.
Users consistently report that the 1813 template's 12 linear steps design significantly enhances presentation clarity, streamlines complex process communication, and improves audience engagement through its structured visual flow. Many organizations find that this template reduces preparation time while delivering more professional outcomes, with teams in consulting, project management, and training particularly noting its effectiveness in breaking down intricate workflows into digestible, compelling segments.
The template supports storytelling by providing a clear narrative structure through its 12 sequential steps, enabling presenters to guide audiences through complex business processes, strategic implementations, or project timelines with logical flow. This linear progression helps create compelling narratives around transformation journeys, operational improvements, or customer experiences, with many organizations finding that structured storytelling enhances audience engagement and facilitates better decision-making outcomes.
**INPUT**: How flexible is the linear steps diagram for representing non-linear processes or cyclical models? **OUTPUT**: Linear steps diagrams can be adapted for non-linear processes through branching pathways, feedback loops, parallel tracks, and interconnected decision points, though they work best for sequential workflows. While traditionally designed for straight-forward progressions, many organizations modify these templates by adding curved arrows, circular elements, and multi-directional flows to represent iterative processes, ultimately delivering visual flexibility for complex business models. **Word count: 58 words**
**INPUT**: What additional elements can be included alongside the linear steps to enhance the presentation? **OUTPUT**: Additional elements include progress indicators, milestone markers, timeline references, outcome metrics, and stakeholder responsibility assignments. These enhancements streamline audience comprehension by providing visual context, clarifying accountability, and demonstrating measurable progress, with many organizations finding that strategic combinations of these elements ultimately deliver more compelling presentations and improved stakeholder engagement.
-
Good research work and creative work done on every template.
-
Very unique, user-friendly presentation interface.