


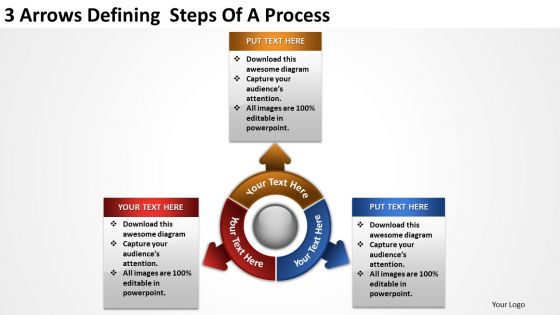
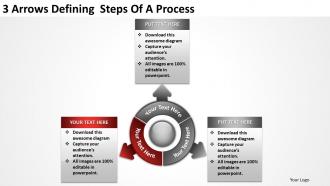
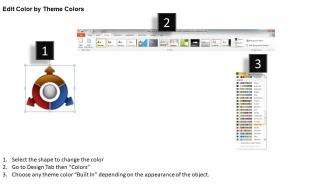
3 arrows defining steps of a process powerpoint templates ppt presentation slides 812




Try Before you Buy Download Free Sample Product
 Impress Your
 Audience
 100%
100% Editable
 Save Hours
 of Time


If you want them to be interested in your presentation you've got to add some emotion. Flip through our thousands of 3 Arrows Defining Steps Of A Process Powerpoint Templates ppt presentation slides 812 to choose the one that depicts the right emotions.
People who downloaded this PowerPoint presentation also viewed the following :
3 arrows defining steps of a process powerpoint templates ppt presentation slides 812 with all 8 slides:
Access to cutting edge design 24/7. Our 3 Arrows Defining Steps Of A Process Powerpoint Templates ppt presentation slides 812 are always here to make your presentations shine.
FAQs for 3 arrows defining steps of a process powerpoint templates ppt
**INPUT**: What are the key components of an effective process step in a presentation template? **OUTPUT**: Effective process steps include clear sequential numbering, concise descriptive titles, supporting visual icons, consistent formatting, and measurable outcomes or deliverables. These components streamline audience comprehension by creating logical flow, reducing cognitive load, and enhancing information retention, with many organizations finding that well-structured process presentations ultimately deliver faster stakeholder buy-in and improved project execution across teams. [Word count: 58 words]
Visual elements enhance process step understanding by transforming complex workflows into digestible, memorable formats through flowcharts, diagrams, icons, and color-coding systems. These design approaches streamline comprehension by creating clear pathways, reducing cognitive load, and enabling audiences to quickly grasp sequential relationships, with many organizations finding that visual process presentations increase stakeholder engagement and accelerate decision-making across teams.
Common mistakes include overcrowding slides with excessive text, using inconsistent visual formatting across steps, neglecting logical flow sequences, omitting clear transition indicators, and failing to maintain visual hierarchy. These design flaws create confusion in presentations, with many organizations finding that streamlined process slides with consistent formatting, clear directional flow, and balanced content distribution ultimately deliver better audience comprehension and more effective stakeholder communication.
Balancing text and visuals in process steps involves using concise, action-oriented language paired with clear diagrams, flowcharts, icons, and visual hierarchies that guide comprehension. This strategic combination streamlines understanding by appealing to different learning styles, reduces cognitive load, and enhances retention, with many organizations finding that well-designed process documentation significantly improves training efficiency and operational consistency.
Icons play a crucial role in process visualization by providing instant visual recognition, reducing cognitive load, maintaining consistency across complex workflows, and transcending language barriers through universal symbols. These visual elements streamline comprehension by creating memorable associations, enhancing information retention, and enabling faster decision-making, with many organizations finding that well-designed iconography significantly improves user engagement and process adoption rates.
Storytelling integration involves embedding narrative elements throughout each presentation phase, including compelling openings with relatable scenarios, data-driven conflict points, and resolution-focused conclusions. Through strategic anecdotes, case studies, and customer journey examples, presenters create emotional connections while maintaining logical flow, with many organizations finding that story-enhanced presentations deliver significantly higher audience engagement and retention rates.
Methods to simplify complex processes include visual flowcharts, step-by-step breakdowns, interactive demonstrations, analogies, and progressive disclosure techniques. These approaches streamline audience comprehension by eliminating jargon, focusing on key decision points, and presenting information sequentially, with many organizations finding that visual storytelling and real-world examples significantly enhance stakeholder understanding and engagement.
Healthcare organizations emphasize evidence-based sequences with clinical outcomes and patient safety protocols, while tech companies focus on agile methodologies, iterative development cycles, and user experience optimization. Educational institutions structure their process presentations around learning objectives, assessment milestones, and curriculum progression, with many organizations finding that industry-specific terminology and regulatory considerations significantly enhance stakeholder engagement and implementation success.
**INPUT**: What tools or software are best for creating dynamic process step visuals? **OUTPUT**: Top tools for dynamic process step visuals include Microsoft Visio, Lucidchart, Miro, Canva, and specialized presentation platforms like SlideTeam. These solutions streamline workflow documentation by offering interactive templates, real-time collaboration features, and automated formatting, with many organizations finding that professional templates significantly reduce design time while delivering polished, scalable process communications. [Word count: 58 words]
Feedback loops can be incorporated through regular checkpoint reviews, stakeholder validation sessions, continuous monitoring dashboards, and iterative testing phases embedded within each process step. These mechanisms enable teams to gather real-time insights, adjust workflows dynamically, and refine deliverables progressively, with many organizations finding that structured feedback integration reduces project risks while accelerating time-to-market and enhancing final outcomes.
Best practices for sequencing process steps include logical flow progression, stakeholder-based ordering, dependency mapping, impact prioritization, and visual hierarchy establishment. These approaches streamline comprehension by grouping related activities, highlighting critical decision points, and minimizing cognitive load, with many organizations finding that strategic sequencing reduces errors, accelerates training, and enhances operational efficiency across departments.
Color coding differentiates process stages by assigning distinct hues to each phase, creating visual pathways that streamline understanding and reduce interpretation errors. Through strategic color application, organizations enhance workflow clarity, accelerate team onboarding, and minimize miscommunication, with many manufacturing and healthcare facilities finding that color-coded processes ultimately deliver faster execution and improved operational efficiency.
Strategies include breaking complex processes into digestible segments, using visual aids and interactive elements, incorporating real-world examples from specific industries, and creating logical narrative flow between steps. These approaches enhance comprehension by maintaining engagement through varied presentation methods, strategic pacing, and practical applications, with many organizations finding that interactive demonstrations and sector-specific case studies significantly improve audience retention and understanding.
Cultural context significantly influences process step presentation through varying communication styles, hierarchical preferences, visual design expectations, and decision-making approaches across regions. For example, East Asian audiences often prefer detailed, sequential workflows with clear authority levels, while Scandinavian regions favor collaborative, flexible processes, and Middle Eastern markets emphasize relationship-building steps, ultimately enabling organizations to enhance engagement and streamline adoption globally.
Successful process presentations include Apple's product launch workflows, McKinsey's strategic consulting methodologies, Toyota's lean manufacturing processes, medical procedure training modules, and software implementation roadmaps. These presentations excel by using clear visual hierarchies, sequential storytelling, and concrete milestones, with many organizations finding that combining flowcharts with real-world case studies ultimately delivers enhanced stakeholder understanding and smoother implementation across teams.
-
Colors used are bright and distinctive.
-
Innovative and Colorful designs.