


5 boxes for campaign kpis and metrics good ppt example




Try Before you Buy Download Free Sample Product
 Impress Your
 Audience
 100%
100% Editable
 Save Hours
 of Time


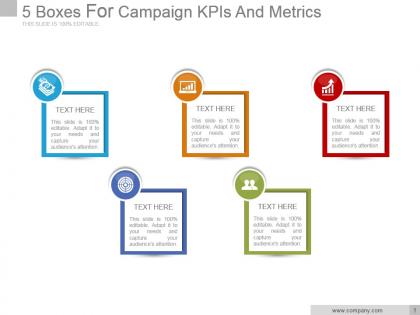
If you want to illustrate your business concepts in a simple and understandable way, then you should use our Five Boxes For Campaign Kpis And Metrics Good PPT template. This KPIS and metrics PowerPoint slideshow has been crafted with colorful visuals and icons for highlighting your important business numbers and concepts. Use this campaign KPIs and metrics PPT visual in your presentations to express views on growth, target, management and planning in business. This campaign KPIs and metrics presentation diagram can help you showcase your research and focus on the details and execution of your marketing plans. This campaign KPIs PPT design clearly and concisely communicates your business's overall aims and objectives and as a tool for planning and strategic decision-making throughout the company. The PPT slide is completely editable so you can add your own data and information. Simply download and use the awesome slide graphic. Analyse errors of judgement with our 5 Boxes For Campaign Kpis And Metrics Good Ppt Example. Identify inputs that were ignored.
People who downloaded this PowerPoint presentation also viewed the following :
5 boxes for campaign kpis and metrics good ppt example with all 5 slides:
Get folks to complement each others actions with our 5 Boxes For Campaign Kpis And Metrics Good Ppt Example. Bring about joint effort.
FAQs for 5 boxes for campaign kpis and metrics
Essential marketing campaign KPIs include conversion rates, cost per acquisition, return on ad spend, click-through rates, and customer lifetime value. These metrics enable organizations to optimize budget allocation, enhance targeting precision, and measure campaign effectiveness across channels, with many companies finding that tracking these KPIs simultaneously delivers improved ROI and strategic competitive advantage.
Establish baseline metrics by analyzing historical campaign data, industry benchmarks, and competitive performance across key areas like engagement rates, conversion percentages, and cost-per-acquisition. Through comprehensive data analysis, organizations can set realistic targets that reflect past performance while accounting for market conditions, with many marketing teams finding that combining internal analytics with industry standards delivers more accurate forecasting and strategic campaign optimization.
Conversion rates serve as the primary indicator of campaign effectiveness, measuring how successfully marketing efforts translate audience engagement into desired actions like purchases, sign-ups, or downloads. By tracking conversion metrics across different channels, campaigns, and audience segments, marketers can identify high-performing strategies, optimize underperforming elements, and allocate resources more strategically, ultimately delivering improved ROI and measurable business growth.
Social media engagement metrics directly influence campaign decisions by revealing audience preferences, optimal content timing, and platform effectiveness through likes, shares, comments, and reach data. These insights enable marketers to reallocate budgets toward high-performing platforms, adjust messaging strategies, and optimize posting schedules, ultimately delivering improved ROI and stronger customer connections across campaigns.
Tracking customer acquisition cost (CAC) enables organizations to measure marketing efficiency, optimize budget allocation, and ensure sustainable growth by comparing acquisition expenses against customer lifetime value. This metric helps businesses identify the most cost-effective channels, refine targeting strategies, and maintain profitability, with many companies finding that strategic CAC management significantly enhances competitive positioning and scalable revenue growth.
Brand awareness measurement combines quantitative metrics like brand recall surveys, social media mentions, website traffic analytics, and search volume data with qualitative indicators including sentiment analysis and share of voice tracking. These methods enable organizations to assess recognition levels across target demographics, monitor competitive positioning, and evaluate campaign effectiveness, ultimately delivering measurable insights that guide strategic marketing investments and enhance market penetration.
Google Analytics, Adobe Analytics, HubSpot, Salesforce, and social media dashboards like Hootsuite excel at real-time campaign KPI tracking. These platforms streamline performance monitoring by consolidating data sources, automating reporting workflows, and delivering instant insights across channels, with many marketing teams finding that integrated dashboards significantly enhance decision-making speed and campaign optimization effectiveness.
Leading indicators predict future campaign performance through metrics like email open rates, click-through rates, website traffic, and engagement levels, while lagging indicators measure actual results including conversions, revenue, ROI, and customer acquisition costs. Understanding this distinction enables marketers to make real-time optimizations using predictive data, ultimately delivering improved campaign outcomes and strategic advantage.
Campaign ROI analysis methodologies include cost-per-acquisition tracking, attribution modeling, lifetime value calculations, multi-touch attribution, and conversion funnel analysis. These approaches enable marketers to measure campaign effectiveness across channels, identify high-performing touchpoints, and optimize budget allocation, with many organizations finding that comprehensive ROI analysis delivers improved campaign performance and strategic competitive advantage.
Setting realistic KPI targets involves researching industry-specific benchmarks through marketing analytics platforms, competitor analysis tools, and trade publications, while considering your audience size, budget constraints, and campaign objectives. Start with conservative baseline targets using historical data from similar campaigns in your sector, then gradually increase goals by 10-15% quarterly, with many marketers finding that incremental improvements deliver sustainable growth and improved ROI.
Common pitfalls include focusing on vanity metrics over meaningful conversions, ignoring attribution windows, comparing campaigns without considering audience differences, and misunderstanding correlation versus causation. Many marketing teams find that rushing to conclusions without sufficient data, overlooking seasonal variations, and failing to account for external factors ultimately leads to misguided optimization decisions and reduced campaign effectiveness.
Customer retention rates significantly impact campaign effectiveness by reducing acquisition costs, increasing lifetime value, and enabling more predictable revenue forecasting. Through strategic retention-focused campaigns, organizations in sectors like telecommunications and subscription services achieve higher ROI, lower churn expenses, and stronger customer relationships, while ultimately delivering sustained growth and competitive advantage in increasingly crowded markets.
Qualitative metrics complement quantitative KPIs by providing context behind the numbers, revealing customer sentiment, brand perception, and emotional engagement that data alone cannot capture. Through social media comments, survey feedback, and focus groups, marketers gain deeper insights into campaign resonance and audience motivations, ultimately enabling more strategic optimizations and stronger customer connections.
A/B testing enables marketers to make data-driven decisions by comparing different campaign elements like headlines, visuals, and call-to-actions to identify top-performing variations. Through systematic testing, organizations can enhance conversion rates, reduce acquisition costs, and maximize ROI, with many companies finding that continuous optimization delivers significantly improved campaign performance and competitive advantage.
Effectively communicating KPI results requires clear visualizations, contextual storytelling, and stakeholder-specific messaging that connects metrics to business outcomes. Use dashboards, executive summaries, and regular reporting cadences to present data transparently, while many organizations find that combining quantitative results with strategic insights and actionable recommendations enhances stakeholder engagement and drives informed decision-making.
-
Great quality slides in rapid time.
-
Use of different colors is good. It's simple and attractive.
-
good
-
good