

Annual Performance Report Of Call Center


Try Before you Buy Download Free Sample Product
 Impress Your
 Audience
Editable
of Time


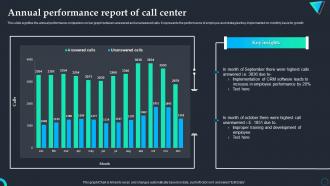
This slide signifies the annual performance comparison on bar graph between answered and unanswered calls. It represents the performance of employee and strategies they implemented on monthly basis for growth.
People who downloaded this PowerPoint presentation also viewed the following :
Annual Performance Report Of Call Center with all 7 slides:
Use our Annual Performance Report Of Call Center to effectively help you save your valuable time. They are readymade to fit into any presentation structure.


FAQs for Annual Performance Report
Stick to the basics that actually matter - average handle time, first call resolution, and customer satisfaction scores. Those three will tell you most of what you need to know. Abandonment rate's huge too (nothing worse than people hanging up). Service level is pretty standard, like how many calls you answer in 30 seconds. Agent utilization matters but honestly gets weird depending on your system setup. Cost per call if your boss cares about money stuff. Don't go crazy though - pick maybe 5-7 max or you'll drown in data and miss the real trends.
Set up a dashboard tracking average handle time, first call resolution, and calls per hour - weekly or monthly works best. Your call center software probably already generates these reports automatically. Getting the data isn't hard, but figuring out what it actually means? That's where people struggle. Don't get caught up in daily ups and downs since they're pretty misleading. Look for patterns instead. When you notice trends (good or bad), schedule one-on-ones with those agents. Consistency matters here - pick a tracking schedule and stick with it, then actually use what you learn to coach better.
Honestly, customer satisfaction is like the reality check for everything else you're tracking. Sure, your response times might look amazing on paper, but if people are still pissed off after calling? Something's broken. CSAT scores show you the stuff that flies under the radar - maybe your agents need better training, or your process is just clunky. I always think it's weird when companies obsess over speed but ignore whether customers actually got helped. Those satisfaction surveys will tell you which agents are crushing it and which parts of your system need work.
Oh man, FCR is like the magic metric that fixes everything else. Fix that first and watch your other numbers get better automatically. Handle times drop because your agents aren't stuck dealing with the same complaints over and over. Customer satisfaction goes up - obviously, since nobody wants to call you three times about their broken whatever. Call volume shrinks too since people aren't rage-calling you back. Honestly it's kinda wild how much of a difference it makes. I'd start by figuring out what's causing all those repeat calls and just... fix those things first.
So for AHT reporting, definitely segment by channel and agent skill level instead of just one big average. Call types matter too - billing questions are obviously way faster than tech support nightmares. I always show current vs previous period plus 90-day trends so you can actually see what's happening. Oh, and exclude those weird outlier calls that mess everything up. Here's the thing though - never look at AHT alone. You've got to pair it with quality scores because rushing through calls just creates more problems later.
Honestly, data analytics will catch stuff your manual reports totally miss - like how certain agents crush it during morning shifts or whatever. Don't get stuck on basic metrics like handle time though. I've watched teams become dashboard addicts (guilty as charged lol), but predictive analytics is where it's at. You'll actually know when to staff up and spot training gaps before they blow up. Set alerts for when performance tanks. Correlation analysis shows what really makes customers happy, not just what you think does. Pick one metric first and expand from there - trust me on this.
Check your performance reports for absenteeism and how many people actually volunteer for overtime - that tells you a lot. Call quality consistency matters too since engaged agents don't have those crazy performance swings. Survey data is honestly your goldmine, but good luck getting people to be real with their answers. I'd also watch retention rates because unhappy agents bail pretty fast. Oh, and track who's asking about promotions internally. Monthly check-ins work well to review all this stuff alongside your regular performance numbers. Gives you the whole story instead of just pieces.
Check your call volumes and what types of issues are coming in - that's where the patterns hide. Like if billing questions suddenly jump 30%, something's obviously confusing people. I always dig into the timing stuff too since it shows you when problems hit worst. Seasonal trends are pretty obvious once you start looking. Honestly, the hourly breakdowns can be super revealing - you'll see certain issues cluster at weird times. Compare month-to-month so you can catch problems early before they blow up into major disasters.
Honestly, just compare before vs after data - that's where you'll actually see if training worked. Pull metrics like handle time, first call resolution, customer satisfaction scores from 30 days before training. Then check again 60-90 days after (people need time to absorb stuff). The real trick? See how long the improvements last because some training just doesn't stick. Set up automated reports so you're not doing spreadsheet hell every month. I learned this the hard way - what feels like great training doesn't always show up in the numbers. Start with one program and you'll quickly figure out what's actually moving the needle.
Yeah, call volume messes with basically every metric you're tracking. When it gets crazy busy, your handle times drop, first call resolution tanks, and customers get pissed because agents are rushing through calls. Here's what I'd do - split your reports by peak vs off-peak hours instead of those useless overall averages. Trust me, showing volume trends next to your performance data makes everything way clearer for stakeholders. Oh and set different benchmarks for busy vs slow periods. Expecting the same performance during Monday morning chaos and a chill Wednesday afternoon? That's just setting everyone up to fail.
Honestly, AI is a game-changer for report accuracy. Your call center agents aren't always gonna log every single detail - we both know that's just reality. But AI monitors everything in real-time and catches stuff humans miss, like sentiment shifts or resolution patterns. No more data entry mistakes either. The best part? You get instant results instead of waiting around for end-of-shift summaries. Oh, and it analyzes way more data than any manual process could handle. I'd start by looking at whatever metrics you're tracking by hand right now - that's where you'll see the biggest improvement.
Honestly, the worst thing you can do is obsess over stuff like total call volume - it looks impressive but tells you nothing useful. Focus on what actually moves the needle: customer satisfaction and resolution rates. Don't cherry-pick your best weeks for reports (guilty as charged lol). Oh, and segment your data by agent skill level - mixing rookies with veterans makes everything messy. Seasonal patterns matter too. Most reports end up being chart vomit that nobody reads anyway. Stick to 3-5 metrics that leadership gives a damn about and tie them to real business impact.
Yeah, just tailor them to whoever's reading them. Executives want the big picture stuff - customer satisfaction, cost per call, efficiency trends. They're not gonna dive into details. Supervisors need the nitty-gritty: agent performance, queue times, hourly call volumes. Generic reports are honestly the worst - I've watched people just stare at them confused. For your agents, give them personal scorecards comparing their numbers to team averages. It's way more motivating. Before building anything though, ask each group what they actually need to decide on. Then make reports that help with those specific decisions. Saves everyone time.
Yeah, collaboration makes a massive difference in call centers. Your agents solve stuff way faster when they're sharing knowledge and backing each other up. Resolution rates go up, customers are happier, and honestly? People actually want to stay in their jobs instead of bailing after three months. Better handoffs between shifts too. The work environment becomes so much less toxic when everyone's helping instead of competing. I'd start small - get people talking in team meetings about tricky cases they've handled, maybe set up a quick chat system so agents can ping each other during calls when they're stuck.
So basically just look at your performance metrics and figure out where you're sucking. Average handle time, first-call resolution, customer satisfaction - whatever's lowest becomes your focus. Honestly, managers love this approach because you're not just making up random goals. Take those team problems and break them into individual coaching sessions. Historical trends help you set deadlines that actually make sense instead of being totally unrealistic. Oh, and make sure each goal connects to something you're already measuring. Otherwise you'll have no clue if people are improving or not.
-
Topic best represented with attractive design.
-
Definitely recommend SlideTeam to all who need help with PowerPoint presentations. Their design team can create anything you need.