




 0 Comment
 Customer Reviews

Retention is not a passive outcome; it is a deliberate strategy. Ask any CEO what keeps them awake at night, and employee turnover will often make the list. Corporate Giants like Netflix, Google, and Salesforce are spending millions not only on the recruitment process but also on retaining their best employees, as they know the price of losing a top performer is staggering.
At the heart of this strategy lies data, knowing why employees stay, why they leave, and what patterns exist beneath the surface. This data is brought to life through a retention dashboard. It converts HR data into a visual narrative, plotting attrition rates, engagement rates, tenure distributions, and exit triggers. By so doing, it enables leaders to shift from reactive firefighting to proactive talent management.
However, retaining talent is not a walk in the park. Which measures are most important - voluntary attrition, promotion rates, or satisfaction scores? What do you do to make them not only accurate but also informative to decision-makers? This is the point at which the majority of HR teams fail: they have the desire to measure retention, but the tools to visualize it effectively fall short.
SlideTeam has curated a list of the best-in-class Customer Retention Templates. Click here to explore.
SlideTeam bridges this gap. Having the knowledge of presentation design, we have gathered a list of retention dashboard templates that make it easier to understand. Such templates enable you to monitor, process, and report workforce data in formats that can be immediately interpreted by executives.
Explore the templates below and learn how you can transform raw data into a retention narrative.
Access SlideTeam’s top-quality Customer Retention Dashboard Templates with a click here.
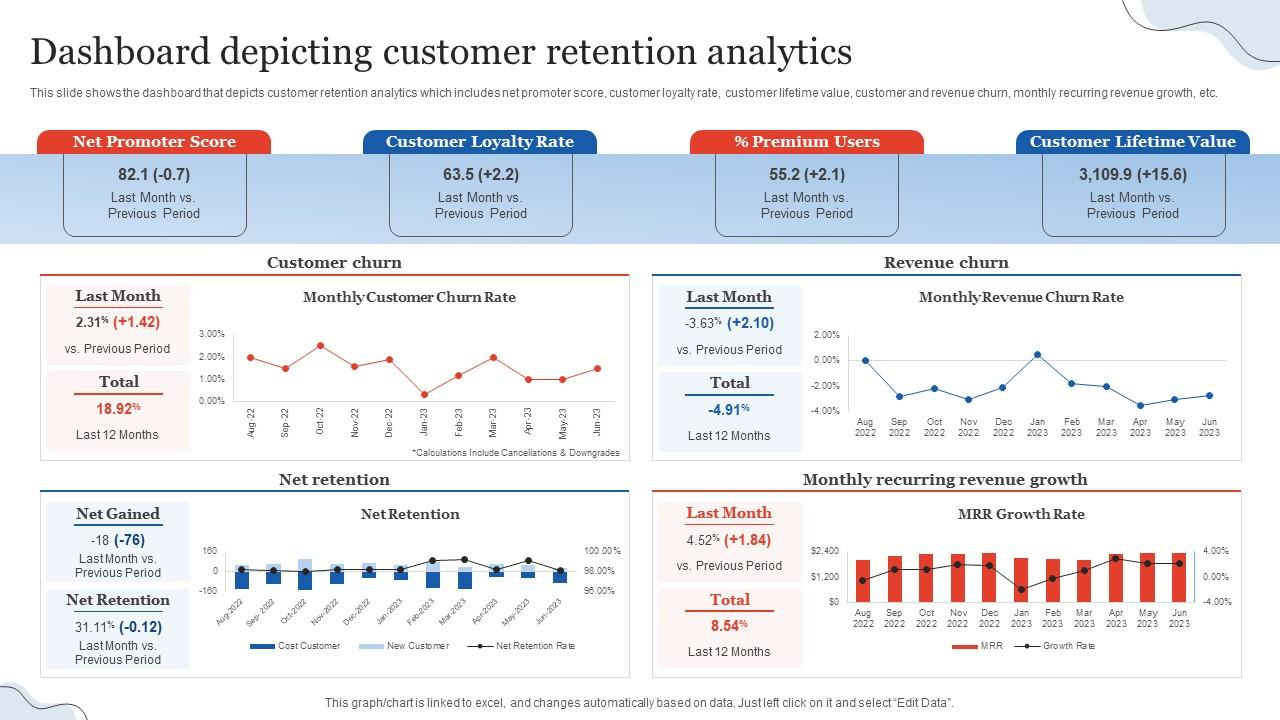
Template 1: Dashboard Depicting Customer Retention Analytics PPT
This PPT Dashboard assists businesses in monitoring and enhancing the retention of customers by offering clear information on important metrics. It puts emphasis on Net Promoter Score, rate of customer loyalty, the rate of premium users, and customer lifetime value. It also tracks churn rates, revenue influence, and net retention, performance, and displays monthly recurring revenue growth trends. Through consolidation of this information, the template helps teams to rapidly determine the risks, gauge the effectiveness of the retention efforts, and implement strategies to reinforce long-term relationships with customers.
Template 2: Employee Retention Dashboard PPT
This PPT Set will enable HR teams to have a clear picture of workforce retention metrics. It focuses on key indicators like the number of people, the balance of gender diversity, absenteeism, length of employment, and the ratio of HR to employees. The templates are used to separate employees into departments, status (full-time/part-time), salary range, and performance rating. Recorded employee history provides clarity, whereas tendencies in the number of departments and tenure allow for determining areas of focus.

Template 3: Customer Retention Dashboard PPT Template
This PPT Slide is used to indicate the retention of customers using key indicators like net revenue, abandonment, and unique visitors. It monitors customer behavior during various phases, discover, compare, acquire, use, and advocacy, reflecting the level of achievement in the form of definite numerical values. It allows companies to evaluate the extent to which they are fostering interaction and retention by connecting customer attitudes to quantifiable results. The tool assists teams in determining gaps, tracking their performance towards targets, and enhancing strategies to elevate retention and customer satisfaction in the long run.

Template 4: SaaS Net and Account Retention Dashboard PPT
This dashboard provides information about the SaaS net and account retention using the MRR, cancellations, and account activity. It shows the trends in net retention in six months, including cancellations, contractions, and expansions, and both direct and partner revenue contributions. The cancelled accounts section gives a clear idea about the lost clients with essential information such as seats, lifetime, and MRR. Moreover, there are visual charts representing account retention trends and retention elements over time to help businesses assess the stability in their accounts and alter strategies to minimize churn and achieve sustainable growth.

Template 5: Employee Retention Dashboard PPT
This PPT Preset provides the HR teams with a clear picture of workforce distribution and retention trends. It emphasizes a number of employees per department, job status, pay scale, as well as absenteeism and tenure. The ratio of gender diversity and headcount is monitored to facilitate the objective of inclusivity, whereas the rating offers information on the performance of the workforce. This template assists organizations in tracking important HR indicators and making effective decisions on enhancing retention and engagement.

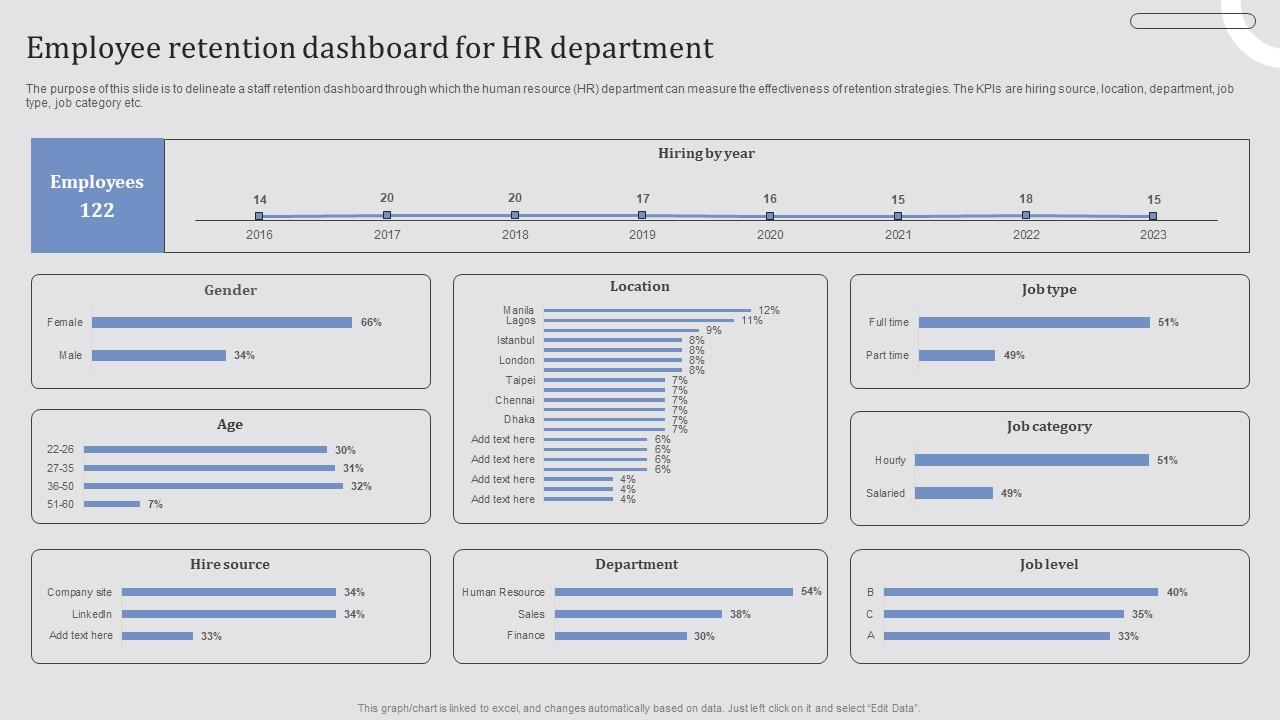
Template 6: Employee Retention Dashboard for HR Department
This dashboard assists in retention tracking of employees in terms of demographics, job category, and recruitment trends. It discusses the gender proportion, age difference, and the trend of hiring approaches. It also presents a clear picture of labor movements. Department and location insights indicate the concentrated location of employees, and the comparison of jobs and categories offers insight into staffing balance. Hire source measures introduce transparency to the recruitment channels. This tool assists HR leaders in assessing retention policies and enhancing workforce planning to ensure better organizational stability.
Template 7: Employee Retention Plan Dashboard PPT
This PPT Deck provides a detailed perspective on plans that can enhance employee retention. It starts with turnover and retention statistics, which show that turnover is high in Q3 and recovered in Q4. The evaluation is followed by a systematic plan that specifies the procedure for improvement. The participation programs focus on flexible work hours, mental health, appreciation, and feedback. Lastly, vocational growth initiatives like training, mentoring, and leadership seminars are also presented.
[product_image id=1471409]
Template 8: Building A Customer Retention Dashboard PPT Template
This PowerPoint Template is aimed at developing and analyzing customer retention dashboards in order to enhance business performance. It highlights the importance of key measures such as churn rates, customer lifetime value (CLV), and engagement scores, used to define the risks and opportunities. The framework emphasizes strategies such as individualized offers, loyalty programs, and feedback loops to help build long-term relations with customers.
[product_image id=1498521]
Template 9: Employee Engagement and Retention KPI Dashboard
This PPT will provide the organizations with the means to monitor, analyze, and enhance workforce satisfaction and retention. It emphasizes the KPIs in terms of engagement score, attrition, and retention rate with both current and target measures. The PPT contains benchmarking charts, churn and retention patterns, and real-life insights to discover strengths and weaknesses. Such trends as remote work and wellness programs, and various employee feedback collection practices are also discussed in the deck. It is a good source of HR information that can promote data-based decisions to enhance the culture, motivation, and loyalty of employees in the long term.
[product_image id=1535704]
Template 10: Maximizing Customer Retention With KPI Dashboards
This PPT presentation assists enterprises in leveraging data-driven approaches and maximizing loyalty and decreasing churn. It begins with articulated goals, an idea of focusing on goals, measurement of KPI, and customer sections, as well as improvement of experience. The deck emphasizes the importance of dashboards in data analysis, alert systems, and performance monitoring, which guarantees proactive retention management. It presents the trends of churn, lifetime value, NPS, and revenue with sample dashboard visuals.
[product_image id=1565106]
Retaining Talent, Sustaining Growth
Retention of employees is not only an HR issue, but a business necessity. A well-designed retention dashboard enables leaders to see red flags early, gauge engagement, and take action on insights before performance is affected. In the absence of this visibility (and clarity), organizations are likely to lose not only people but also knowledge, stability, and competitive advantage.
SlideTeam's to-draw retention dashboard templates offer the structure and clarity required to convert workforce data to actionable intelligence. Get these templates now and create a culture in which employees would want to stay, develop, and flourish.
FAQs on Retention Dashboard
What is an employee retention dashboard, and why do companies use it?
An employee retention dashboard is a visual tool that measures metrics such as turnover rate, satisfaction, and tenure to be tracked and enhanced to manage the retention strategies. These dashboards help companies to have data-driven knowledge about why employees leave and, as such, make informed decisions to increase morale, reduce replacement costs, and create a better and more stable, engaged, and high-performing workforce.
How can HR teams measure staff retention with a dashboard?
To measure staff retention using a dashboard, HR staff would show key performance indicators (KPIs) such as turnover and engagement rates using graphs and charts to recognize trends and patterns. The dashboards provide drill-down and interactive features to examine retention by department, location, or demographic to assist HR in identifying particular problems and introducing specific programs to enhance employee retention.
What are the most important KPIs in an employee retention dashboard?
The KPIs that are the most vital towards an employee retention dashboard encompass the employee retention rate, voluntary and involuntary turnover rates, average employee tenure, employee satisfaction and engagement rates, and the cost of employee turnover.