





 0 Comment
 Customer Reviews

The report's ready. Has been since Tuesday.
But nobody's opened the partner review deck yet. Not the channel manager. Not the regional VP. Not the alliances lead who asked for it in the first place.
It's not that the data's wrong. The numbers are probably fine—pipeline figures pulled from CRM, revenue attributed, deal stages mapped. The problem is that nobody can look at it and immediately know what's happening. There's a spreadsheet, a few slides, maybe a pivot table someone exported. And somewhere in all of that is the actual story about which partners are performing, which aren't, and why.
That gap—between having the data and being able to present it clearly—is where partner reviews quietly fall apart. A channel manager knows their top three resellers are underdelivering. But saying that out loud, with a slide behind you that actually shows it? That's different. That takes a structure most people don't have time to build.
And it compounds. Partner performance reviews happen quarterly. Partner onboarding dashboards need updating every cycle. Someone always wants a capability scorecard before the QBR. Someone else needs pipeline visibility broken down by tier. The ask is constant; the time to build from scratch never materializes.
So the templates exist. Not because dashboards are complicated to design—they are, but that's not the point. They exist because the business partner dashboard conversation happens over and over, and every time, someone's rebuilding the same structure instead of just filling it in.
SlideTeam's pre-designed business partner dashboard templates handle the part that stalls most teams—the layout, the KPI framing, the visual hierarchy. They're content-ready frameworks built for exactly this kind of recurring, high-stakes reporting.
Here's what's available.
Template 1: Partner Executive Performance Dashboard Managing Strategic Partnerships
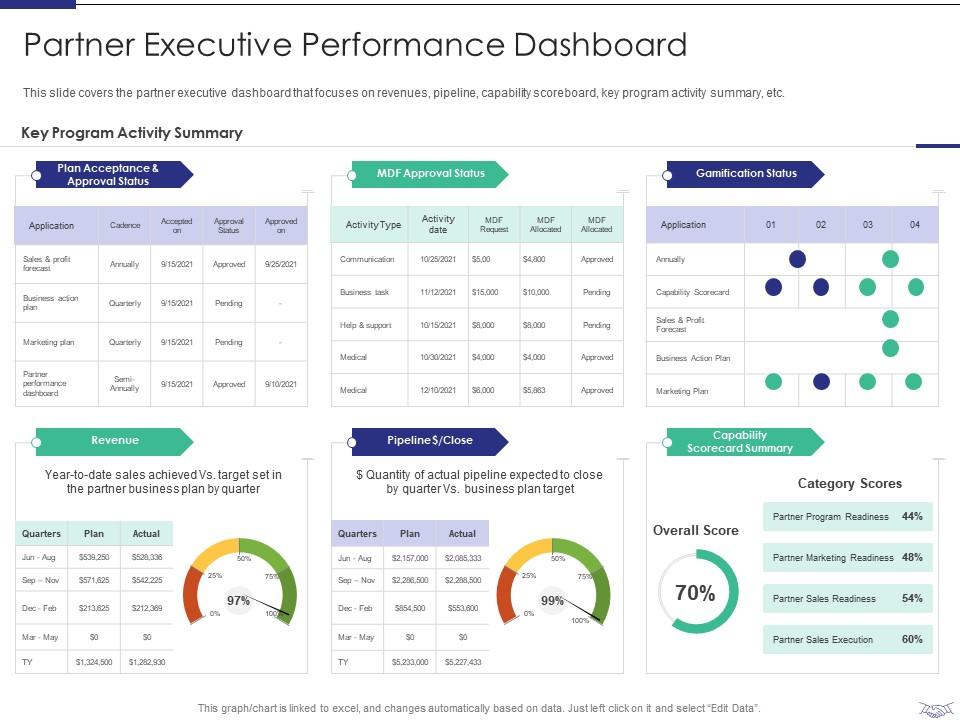
Executive-level partner reporting rarely gets the visual structure it deserves. This PowerPoint slide is built for alliance managers and VP-level reviewers who need a single view of partner performance. It covers revenue, pipeline dollar close, capability scorecard summaries, and gamification status in one coherent layout. For teams running partner performance metrics reviews or quarterly business reviews, this PPT cuts preparation time considerably. The template is 100% editable and customizable.
Download this PowerPoint Template
Template 2: Partner Executive Performance Dashboard Build a Dynamic Partnership
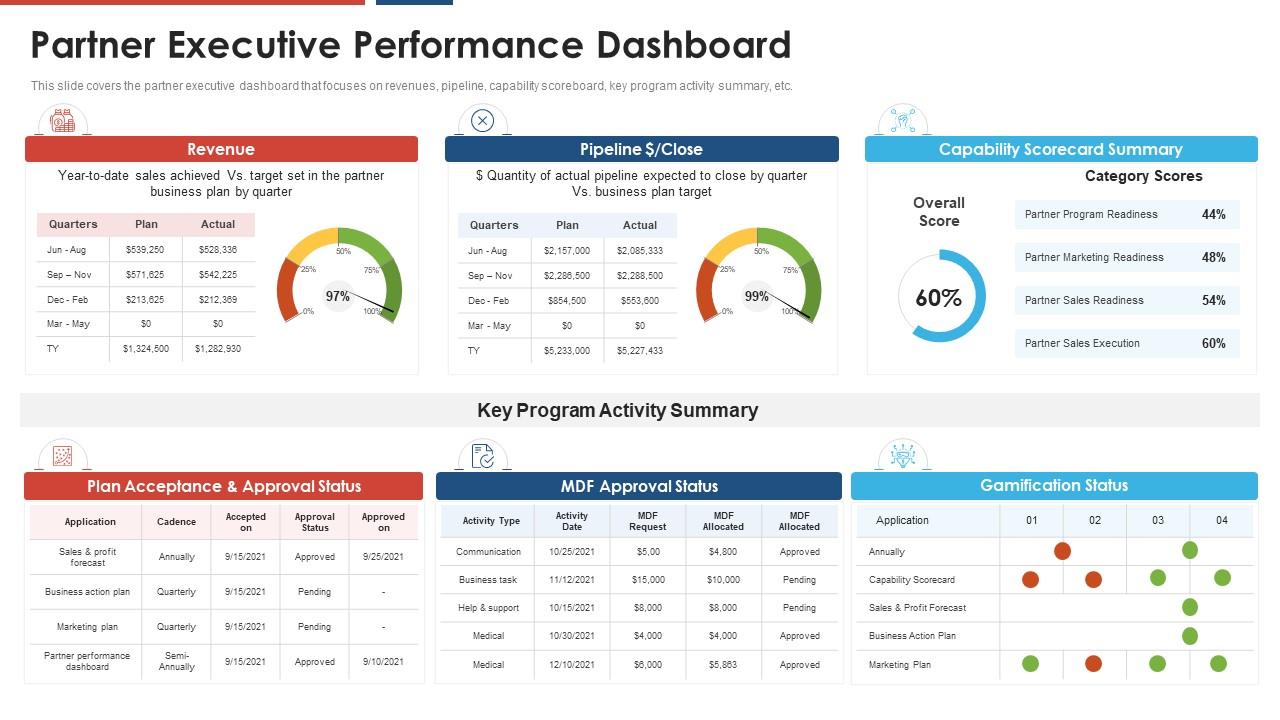
Quarterly business planning with partners often stalls when there's no shared frame of reference. This PPT template gives revenue leads and channel managers a structured view of business plan targets against actual pipeline quantity. It surfaces gaps between planned and actual figures quickly. Sales and alliances teams running partner pipeline management reviews will find this slide particularly useful for focused, evidence-based conversations. The template is 100% editable and customizable.
Download this PowerPoint Template
Template 3: Partner Relationship Management PRM Partner Executive Performance Dashboard
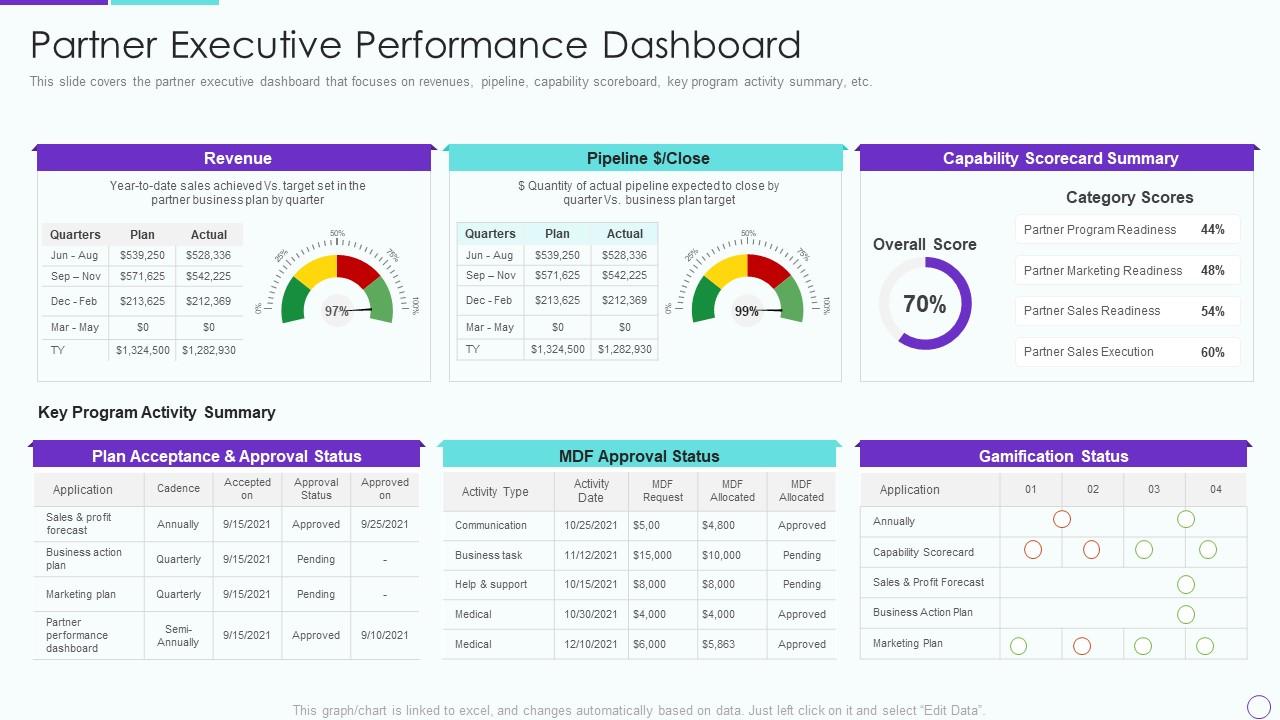
Partner Relationship Management data rarely lives in one place, which is exactly why a consolidated view matters. This PPT preset brings together key program activity summaries, capability scorecards, gamification status, MDF approval status, and revenue in a single dashboard. For PRM teams managing multiple partner tiers, this slide supports structured reviews without requiring manual data consolidation. It fits naturally into business partner dashboard workflows where clarity across program dimensions is non-negotiable. The template is 100% editable and customizable.
Download this PowerPoint Template
Template 4: Business Partner Introduction PowerPoint PPT Outline
First impressions in a partner introduction matter more than most decks suggest. This slide delivers a clean, structured opening for business partner introductions that immediately signals professionalism. Bold visual design captures audience attention and holds it through key messaging. Adaptable color themes let you align the presentation with your brand identity effortlessly. Use this layout to set the tone for strategic partner onboarding conversations with confidence. Transform your partner introduction presentations today. Download this dynamic template now and unlock a stronger first impression.
[product_image id=1699886]
Template 5: Dashboard for Business Financial Performance Management
Financial performance visibility is what separates informed partner conversations from guesswork. This template drives clarity across accounts receivable, accounts payable, equity ratio, debt ratio, and current ratio—all in one dashboard. Each metric connects directly to the financial health story you need to tell. The structured layout makes complex B2B dashboard analytics instantly readable for finance and operations leads alike. Transform your financial performance presentations today. Download this dynamic template now and unlock sharper business conversations.

Download this PowerPoint Template
Template 6: Partner Executive Performance Dashboard Effective Partnership Management Customers
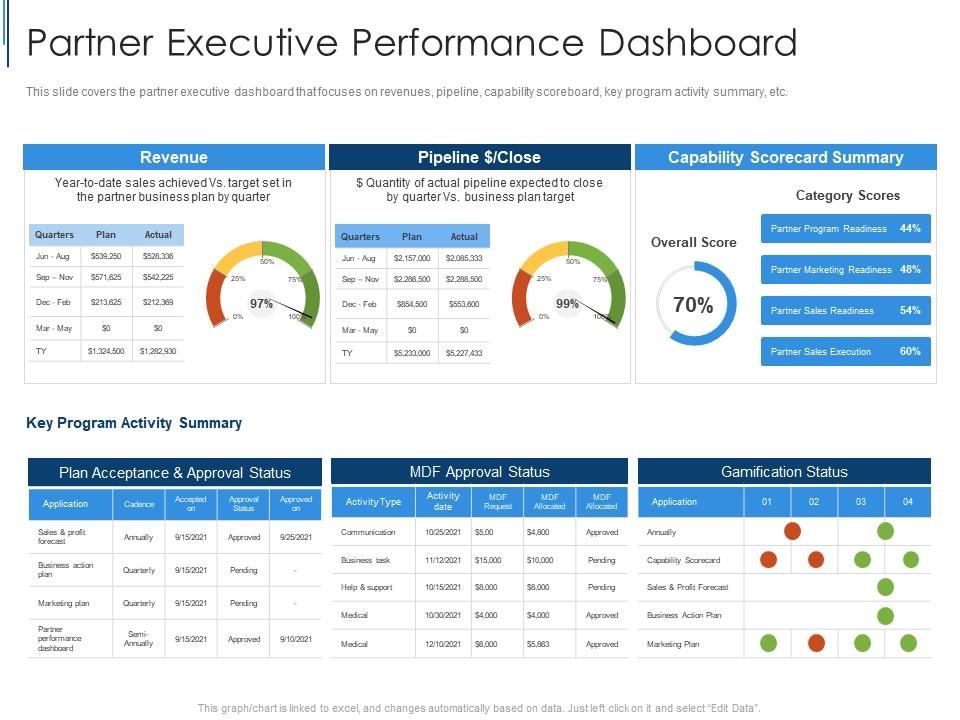
Effective partnership management depends on seeing capability gaps and approval bottlenecks early. This PPT preset is built for partner managers who need to present capability scorecard summaries alongside plan acceptance and approval status. It consolidates activity summaries in a format that drives focused discussion rather than open-ended Q&A. Teams handling channel partner management reviews will find the layout supports clear, accountable conversations. The template is 100% editable and customizable.
Download this PowerPoint Template
Template 7: Build a Dynamic Partnership Business Partners Dashboard
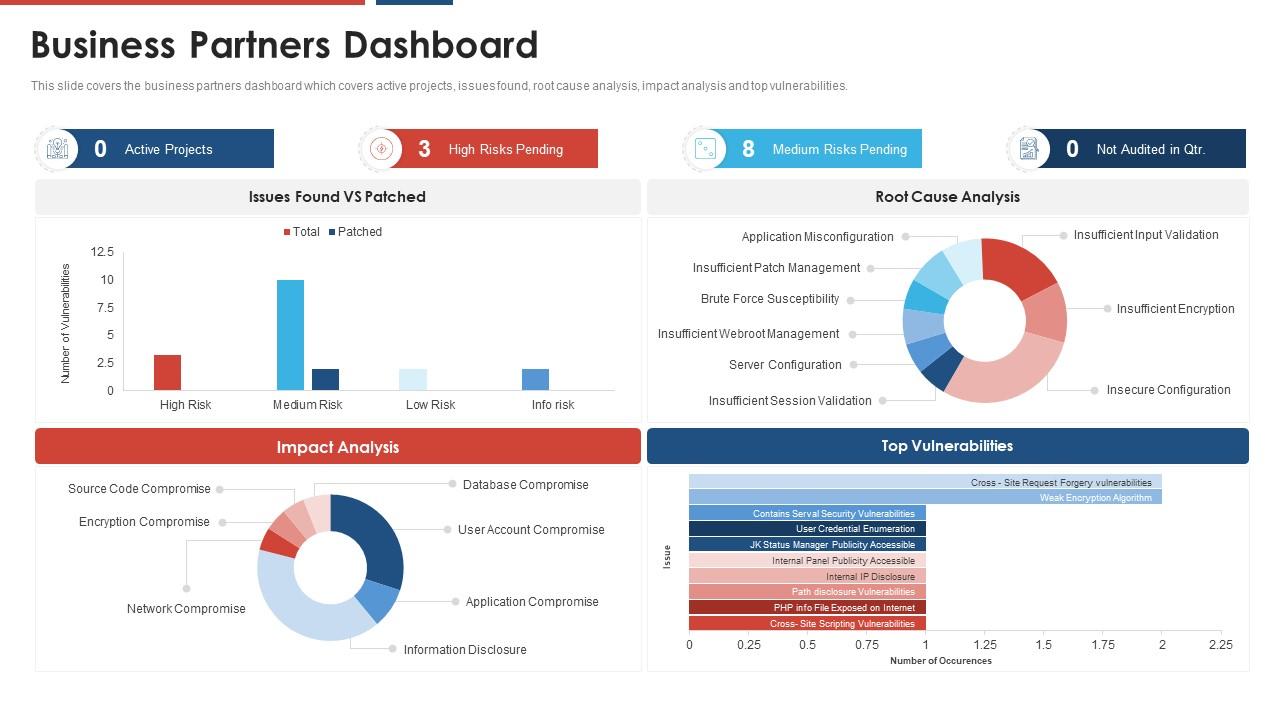
Active project health and vulnerability tracking rarely get a clean visual home in partner dashboards. This slide surfaces active projects, issues found, root cause analysis, impact analysis, and top vulnerabilities in one structured view. Misconfiguration, insufficient patch management, and session validation gaps are all represented clearly. For teams managing complex partner ecosystems, this PPT brings partner ecosystem analytics into a format that non-technical stakeholders can act on. The template is 100% editable and customizable.
Download this PowerPoint Template
Template 8: HR Business Partner Model Dashboard
HR business partnering decisions depend on clean demographic and diversity data. This PPT slide gives HR leaders a structured dashboard view of gender diversity, female representation percentages, and related workforce variables. It turns multi-variable HR data into a readable single-screen summary. Teams running HR business partner model reviews or workforce planning cycles will find this deck supports faster, more grounded decisions. The template is 100% editable and customizable.
[product_image id=1136761]
Template 9: Partner Relationship Management Customer Satisfaction KPI Dashboard
Customer satisfaction data loses its impact when scattered across reports. This PPT preset consolidates net promoter score, customer effort score, and satisfaction scores across product quality, pricing, design, and service into one KPI dashboard. For partner relationship management teams, it connects CRM partner integration data to real customer experience outcomes. The structured layout makes KPI storytelling straightforward for both internal reviews and partner-facing conversations. The template is 100% editable and customizable.

Download this PowerPoint Template
Template 10: Customer Relationship Management Dashboard Partner Relationship Management PRM
CRM activity tracking is only useful when it's visible at a glance. This PowerPoint slide presents in-progress and completed activities, lead target details, lead stage, and last contact data in a clean, navigable layout. For teams managing partner relationship management workflows, it bridges the gap between raw CRM data and meaningful progress reporting. Sales ops and channel managers will find this slide useful for weekly pipeline reviews. The template is 100% editable and customizable.

Download this PowerPoint Template
Template 11: Business Partners Dashboard PPT Slides Guide Partner Relationship Management PRM
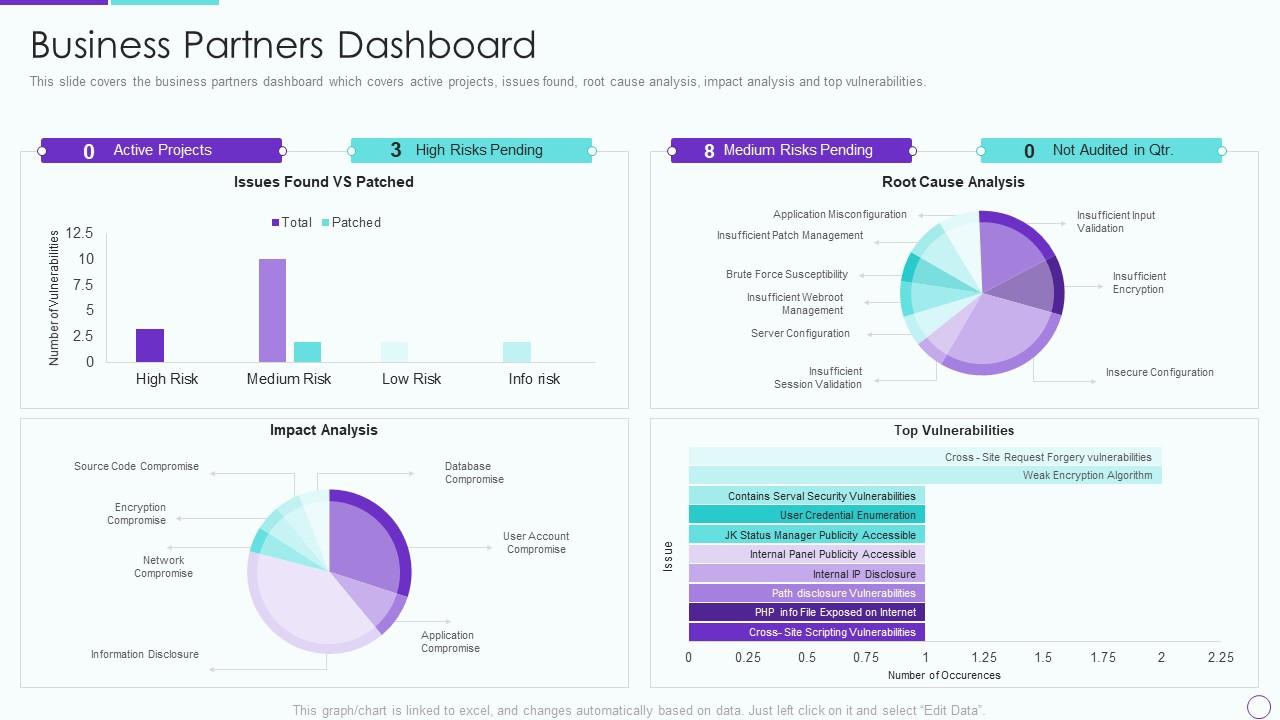
Risk visibility across active partner projects is something most dashboard formats handle poorly. This PPT template covers active projects, high and medium risks pending, unaudited quarters, impact analysis, and top vulnerabilities in one structured view. For teams responsible for partner business planning and governance, this slide makes risk status immediately actionable. It's built for partner managers who need to present complex project health data without losing the room. The template is 100% editable and customizable.
Download this PowerPoint Template
Template 12: HR Business Partner Key Metrics Dashboard PPT Example
HR metrics gain credibility when they're presented in a visually coherent framework. This template delivers a polished HR Business Partner Key Metrics dashboard that captures workforce KPIs with clarity. Customizable color schemes align effortlessly with your organization's brand identity. The structured visual hierarchy ensures every metric commands attention without overwhelming the viewer. Use this layout to elevate HR business partner reporting from routine updates to strategic presentations. Transform your HR metrics reviews today. Download this dynamic template now and unlock data-driven people decisions.
[product_image id=1570180]
Template 13: KPI Dashboard to Measure Partner Performance Ensuring Business Success Maintaining
Measuring partner performance against business plan targets requires more than a spreadsheet. This template delivers a focused KPI dashboard covering partner revenue, number of pipelines closed, and pipeline amount versus business plan target. Each KPI is framed for immediate comparison—actual versus planned, at a glance. Use this layout to drive accountability in partner sales dashboard reviews and quarterly business conversations. Transform your partner KPI presentations today. Download this dynamic template now and unlock sharper partner performance tracking.

Download this PowerPoint Template
Template 14: Customizable Partner KPI Dashboard for Business Growth PPT Designs
Partner KPI reporting only works when the dashboard reflects what each business relationship actually demands. This PPT preset gives channel and alliances teams a flexible, growth-oriented KPI layout that adapts to different partner tiers and program structures. It supports partner ROI tracking conversations without forcing a one-size-fits-all metric view. Teams managing distributor management dashboards or co-selling partner tools reviews will find this deck delivers structure without rigidity. The template is 100% editable and customizable.
[product_image id=1828119]
Template 15: Business Partners Dashboard for Effective Partnership Management PPT Mockup
Partnership management presentations often fail not on content but on structure. This template delivers a Business Partners Dashboard mockup that organizes partnership data into an immediately navigable visual layout. Strong design hierarchy guides stakeholders through performance data without requiring verbal explanation. Flexible color schemes and adaptable layouts mean every partnership tier can be represented accurately. Use this deck to run cleaner, faster effective partnership management reviews. Transform your partner dashboard presentations today. Download this dynamic template now and unlock more productive partnership conversations.
[product_image id=1589911]
Template 16: Partner Executive Performance Dashboard Improve Management Complex Business
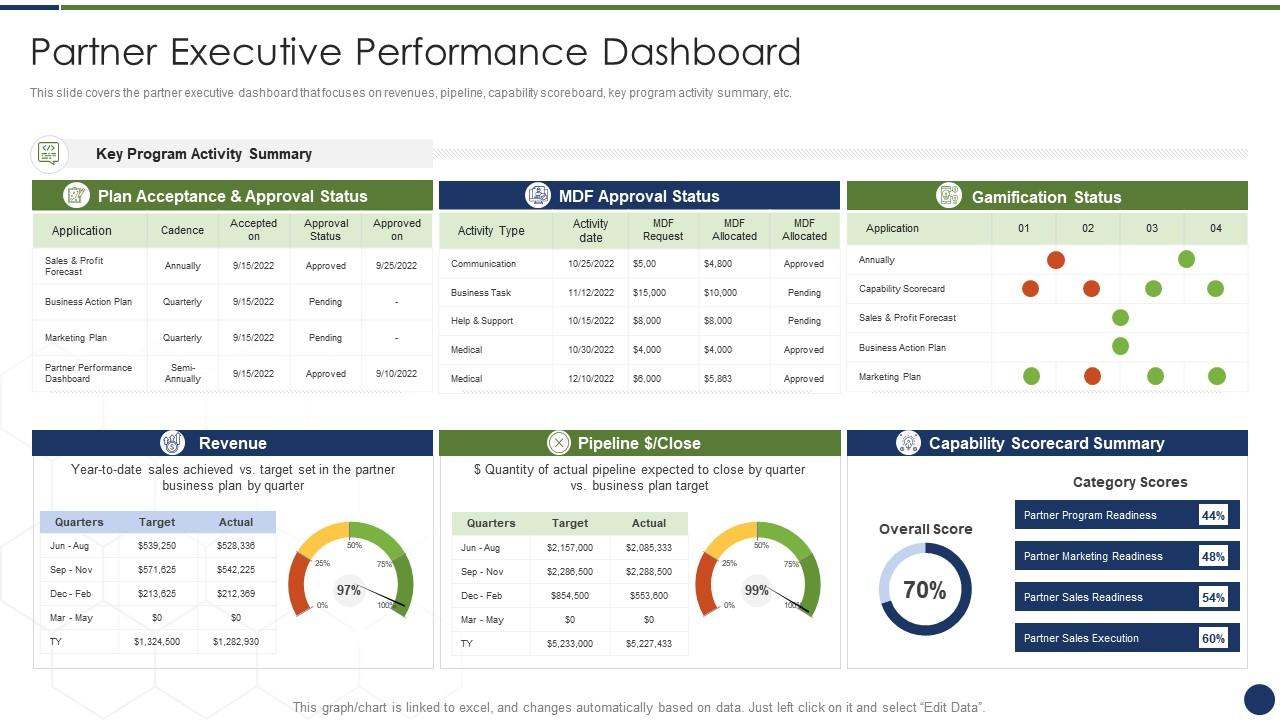
Revenue and pipeline visibility sit at the core of every credible executive partner review. This PowerPoint slide presents revenue, pipeline dollar targets, capability scorecard summaries, and plan targets in a single, executive-ready layout. For VPs and alliance directors running complex partner portfolios, this PPT makes strategic partner management conversations more structured and less reactive. It's the kind of slide that replaces three separate reports with one clear view. The template is 100% editable and customizable.
Download this PowerPoint Template
Template 17: Finance Business Partner Success Strategies PPT
Finance business partnering requires a deck that matches the precision of the numbers it carries. This template combines a clean, professional layout with the flexibility to support boardroom presentations and client pitches equally well. Strong visual design ensures financial narratives land with the authority they deserve. Adaptable layouts let you tailor the structure to specific finance partner success conversations. Use this deck to make every finance business partner presentation a confident, credible one. Transform your finance presentations today. Download this dynamic template now and unlock lasting stakeholder impact.
[product_image id=1832258]
Template 18: Partner Dashboard Analytics for Channel Management PPT Example
Channel management analytics need a visual home that matches their operational complexity. This template delivers a partner dashboard analytics layout built for channel sales dashboard reporting and channel partner management reviews. Clean design balances simplicity with depth, letting data speak without visual clutter. Adaptable color themes and flexible structures mean you can present any channel's performance story clearly. Use this deck to elevate your partner analytics presentations beyond generic reporting. Transform your channel management presentations today. Download this dynamic template now and unlock sharper partner proposal and analytics conversations.
[product_image id=1593106]
Template 19: HR Business Partner Dashboard to Analyze Critical KPIs
HR dashboards often try to show everything and end up communicating nothing clearly. This PPT slide focuses the view: total employees, salaries, and women ratio in one consolidated layout built for HR business partners who need to present workforce data quickly. It's the kind of dashboard that supports talent reviews, workforce planning, and diversity reporting without requiring a separate deck for each. For HR teams running critical KPI analysis, this slide does the heavy lifting. The template is 100% editable and customizable.
[product_image id=1136760]
Template 20: Actual and Planned Partner Executive Performance Dashboard Effective Partnership Management Customers
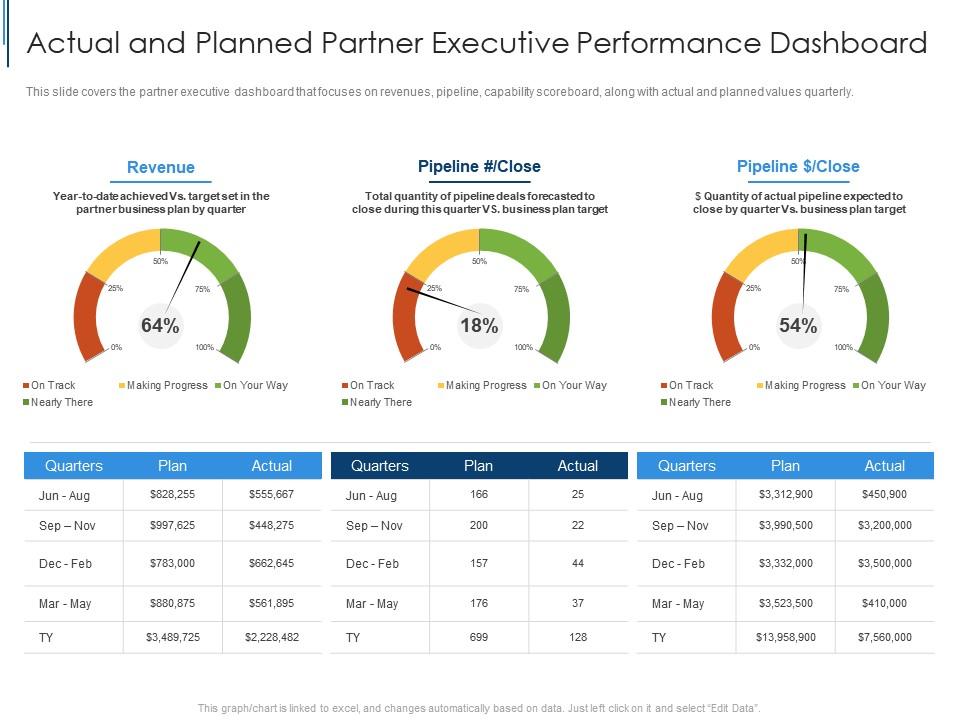
Actual versus planned performance is the most important comparison in any partner executive review. This PPT preset structures quarterly actual and planned partner performance data—covering revenues, pipeline, and capability scorecards—in a side-by-side format that makes variances immediately visible. For partner revenue tracking conversations at the executive level, this slide removes ambiguity and focuses discussion on gaps that matter. It's built for teams that need to move from data to decision quickly. The template is 100% editable and customizable.
Download this PowerPoint Template
Elevate Every Partner Review with SlideTeam
SlideTeam's PowerPoint templates are the best in the industry for business partner dashboard reporting. These content-ready slides deliver professional visual structure for partner performance metrics, pipeline tracking, and KPI reviews—saving teams hours of build time. Use these ready-made frameworks to turn raw partner data into clear, executive-ready presentations. Deploy these PowerPoint slides to drive accountability, sharpen partner conversations, and ensure every review lands with impact.
FAQs on Business Partner Dashboard
What key performance indicators should be prioritized on a business partner dashboard to drive actionable insights?
Focus on four to five KPIs that directly connect to business outcomes. Revenue contribution, pipeline value, deal close rate, and partner engagement score cover the essentials. Add capability scorecard status if you're tracking partner readiness. Avoid loading the dashboard with vanity metrics — each KPI should trigger a specific action or decision when it moves.
How can a business partner dashboard be customized to reflect the unique goals of different partner tiers?
Map each partner tier to a distinct set of goals first — platinum partners need pipeline and revenue views; emerging partners need onboarding and capability metrics. Then filter the dashboard to show only tier-relevant KPIs. A single dashboard template with configurable views by tier keeps reporting consistent without forcing every partner into the same frame.
What role does real-time data integration play in enhancing the effectiveness of a partner dashboard?
Real-time data removes the lag between partner activity and management response. When CRM and ERP feeds update the dashboard live, you catch pipeline stalls and approval delays before they compound. Without it, partner reviews are based on last week's reality. The practical priority is connecting your CRM partner integration first — that's where most actionable signals originate.
How should revenue contribution and pipeline visibility be balanced on a partner-facing dashboard?
Give revenue contribution and pipeline visibility equal real estate, but separate them visually. Revenue tells you what happened; pipeline tells you what's coming. Partners need to see both to self-correct. A split layout — revenue actuals on one side, pipeline stage breakdown on the other — is the simplest format that works consistently across partner tiers.
What are the most common design mistakes that reduce the usability of a business partner dashboard?
The most common mistakes are overcrowding (too many metrics on one screen), inconsistent color use that makes priority unclear, and missing comparison baselines. A dashboard without a target or prior-period reference tells you nothing actionable. Keep each view to five KPIs maximum, use color only to signal status, and always show actuals against a plan.
How can a partner dashboard help identify underperforming partners before issues escalate?
Track pipeline age, activity recency, and capability score together — not just revenue. A partner going quiet on deal registration or skipping training cycles is a leading indicator of underperformance. Set threshold alerts on each metric. Catching two consecutive quarters of low pipeline activity is far cheaper than managing a partner exit.
What metrics best capture partner engagement beyond simple sales numbers?
Track training completion rates, MDF utilization, deal registration frequency, and portal login activity. These reflect active investment in the partnership rather than just output. A partner with low sales but high training completion is a different problem than one with low sales and zero portal activity. The distinction matters for intervention decisions.
How do co-marketing and co-selling activities get reflected accurately in a partner dashboard?
Assign co-marketing spend and co-selling deal registrations their own dashboard rows, tagged by partner and campaign. Pipeline influenced by joint activity should be flagged separately from solo-partner pipeline. Attribution requires agreement upfront — define what counts as co-sell before tracking it. Without that, the numbers are accurate but meaningless for evaluating joint program ROI.


