





 0 Comment
 Customer Reviews

The deck's due Friday. The data's been sitting in three different folders for two weeks.
Not because nobody did the work. The work's done—surveys collected, exports pulled, pivot tables half-finished. But somewhere between "we have the data" and "here's what it means," something breaks. The presentation keeps getting pushed because nobody can agree on what the slides should actually say.
This is the thing about data analysis that nobody admits out loud: the analysis itself isn't usually the hard part. The hard part is deciding what you're analyzing, why, and in what order—before you touch a single chart. That decision is what a data analysis plan is supposed to settle. And most teams don't have one. Or they have something that looks like one but is really just a list of questions somebody typed into a doc at 11pm.
So the presentation becomes this patchwork. A few charts someone thought looked good. A table that made sense three weeks ago. A slide titled "Key Insights" with four bullet points that don't quite connect to each other. The kind of deck where the audience nods politely and then asks a question that's actually just "what are you trying to say?"
It's not a data problem. It's a structure problem.
Data analysis plans exist because someone, at some point, decided the chaos of ad-hoc analysis was costing too much—in time, credibility, and decisions made on the wrong numbers. A good plan defines what you're measuring, how you're measuring it, who's responsible, and what a result actually means before anyone opens the spreadsheet.
That's where SlideTeam's pre-designed templates come in. They handle the part most analysts skip: the structure. Ready-made frameworks that let you focus on the actual thinking, not on building slides from scratch at midnight.
What follows are twenty templates that work—from five-year analytics roadmaps to quantitative data analysis step-by-step guides. Pick the one that fits where you are.
Template 1: Data Analytics Five Years Action Plan Roadmap
A five-year data analytics roadmap demands clear milestones and measurable outcomes across every phase. This slide delivers exactly that—a structured, time-bound framework that maps your analytics ambitions to actionable yearly goals. Intuitive visual progression gives stakeholders instant clarity on where you are and where you're headed. The striking layout captures executive attention from the first slide. You can build compelling data analytics roadmaps that align cross-functional teams around shared priorities. Transform your long-term data analysis strategy presentations today. Download this dynamic template now and unlock your five-year planning potential.

Download this PowerPoint Template
Template 2: Data Analysis Project Plan for Transformation PPT Toolkit
Turning data into decisions requires a clear methodology, not just good intentions. This PPT template walks practitioners through every stage of the analytics lifecycle—from defining business objectives to data understanding, preparation, modeling, and final visualization. Project leads and business analysts reach for this slide when kicking off a data analytics transformation initiative. It works especially well for presenting a structured analytical research design to a cross-functional audience. The template is 100% editable and customizable.

Download this PowerPoint Template
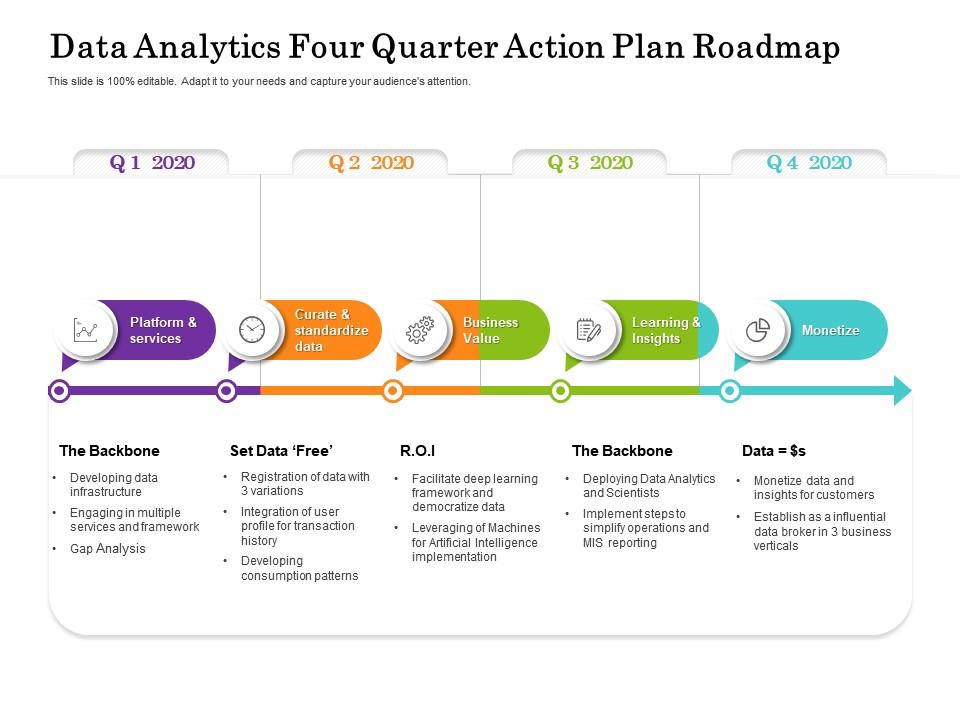
Template 3: Data Analytics Four Quarter Action Plan Roadmap
Four quarters go fast when there's no plan anchoring the work. This PPT preset gives analytics teams a clean, quarter-by-quarter roadmap to track progress against a business intelligence plan across a full year. Program managers and data leads use it to align stakeholders on what gets done, in which quarter, and why. It also fits neatly into quarterly business reviews where timelines and priorities need to be visible at a glance. The template is 100% editable and customizable.
Download this PowerPoint Template
Template 4: Data Analytics Six Months Action Plan Roadmap
Six months is a tight window to move from data collection to insight delivery. This template structures the entire half-year analytics sprint into a clear, phase-by-phase roadmap your team can actually follow. Compelling visual time-banding ensures every milestone stays visible and accountable throughout the review cycle. The polished design commands attention in cross-functional planning sessions and sprint reviews alike. You can build precise data analysis plan roadmaps for mid-year performance cycles effortlessly. Transform your short-cycle analytics presentations today. Download this dynamic template now and unlock your six-month data analysis planning potential.

Download this PowerPoint Template
Template 5: Data Collection and Analysis Plan PPT Slides
Good data collection plans rarely survive contact with a poorly structured presentation. This PPT slide gives analysts and research leads a visually striking framework to present data collection and analysis plans with authority. It suits client pitches, boardroom reviews, and internal project kick-offs equally well. Teams working on research data management or structured data analysis will find the layout immediately practical. The template is 100% editable and customizable.
[product_image id=1490498]
Template 6: Data Migration Plan Approach for Analysis
Data migration without a clear analysis plan is where projects go wrong quietly. This slide covers six key stages—analysis and discovery, extract, cleanse, validate, load, and reconcile—in one visual sequence. IT leads and data architects use this PPT when they need to walk a technical or executive audience through a migration methodology. It's also useful for data governance framework presentations where process accountability needs to be visible. The template is 100% editable and customizable.
[product_image id=941785]
Template 7: Developing Data Collection Plan for Customer Satisfaction Sigma Process Excellence
Measuring customer satisfaction starts with knowing exactly what you're collecting and why. This PPT template structures a complete data collection plan—objectives, data collection methods, sources, and procedures—in a single, scannable format. Quality managers and Six Sigma practitioners reach for this slide when presenting measurement plans to operations or leadership teams. It fits naturally into any process excellence review where data collection methods need to be justified and tracked. The template is 100% editable and customizable.
[product_image id=1301582]
Template 8: Data Analysis Project Plan Business Analytics Transformation Toolkit
Business analytics transformations stall when teams can't agree on the methodology. This deck maps the full analytics workflow — from business issue understanding through data preparation, modeling, validation, and presentation—across six clear stages. Analytics leads and transformation consultants use this PPT when they need to bring a mixed audience up to speed quickly. It's built for program planning sessions where both technical depth and executive clarity matter simultaneously. The template is 100% editable and customizable.

Download this PowerPoint Template
Template 9: Data Analysis and Insights Overview PPT Outline
A data insights overview needs to land fast—audiences lose patience within the first two slides. This deck captures attention immediately with a structured layout that moves audiences from raw findings to clear conclusions without confusion. Flexible design elements let you adapt the visual flow to your specific data interpretation framework. The presentation works equally well for internal reporting cycles and external stakeholder briefings. You can build persuasive data analysis and insights overviews that drive confident decisions. Transform your data reporting presentations today. Download this dynamic template now and unlock your insights communication potential.
[product_image id=1723797]
Template 10: Data Collection and Analysis Monitoring Plans PPT
Monitoring plans live and die on how clearly they communicate what's being tracked and why. This PPT slide gives program managers and evaluation leads a sharp, audience-ready framework for presenting data collection and analysis monitoring plans. It works for ongoing research data management reviews where stakeholders need regular visibility into collection progress. Use it equally for performance metrics analysis updates or mid-program evaluation checkpoints. The template is 100% editable and customizable.
[product_image id=1562440]
Template 11: Data Collection Plan Methods Tools and Responsibilities PPT Graphics
Accountability gaps in data collection sink projects before the analysis even starts. This deck maps methods, tools, and responsibilities into a single, clear visual structure that removes ambiguity from the collection process. Every team member and stakeholder can see who owns what and which tools support each step. The layout is built for planning sessions where data processing techniques and team roles need to be assigned and confirmed together. You can build data collection plan presentations with full role clarity. Transform your data accountability presentations today. Download this dynamic template now and unlock your collection planning potential.
[product_image id=1782192]
Template 12: Data Analytics Evolution a Five-Year Plan PPT Outline
Five years of analytics evolution is hard to communicate without a strong visual spine. This PPT preset gives data leaders a structured, stage-by-stage view of how analytics capabilities grow from foundational to predictive over time. Chief Data Officers and analytics program leads use this slide to align boards and executive teams on a long-term data analytics strategy. It's particularly useful when presenting a predictive analytics framework roadmap to stakeholders who need the big picture, not the technical detail. The template is 100% editable and customizable.
[product_image id=1562435]
Template 13: Data Collection Plan Sampling Analysis and Reporting Techniques
Sampling, analysis, and reporting belong in one plan—not three separate documents nobody reads. This PPT template pulls those components into a single, structured deck that research leads and analysts can adapt quickly. It suits teams presenting a descriptive statistical analysis plan or a full data reporting framework to a mixed technical and business audience. The ready-made design saves preparation time without sacrificing the clarity that stakeholders expect. The template is 100% editable and customizable.
[product_image id=1782193]
Template 14: Steps to Plan and Execute Data Analysis Projects PPT Graphics
Executing a data analysis project without a clear step-by-step plan produces results that nobody trusts. This PPT slide walks project teams through planning and execution in a logical, visual sequence that any audience can follow. Data analysts and project managers use this deck when they need to present a research analysis framework to sponsors or review boards. It also works for exploratory data analysis kick-offs where the scope and sequence need to be agreed upon before work begins. The template is 100% editable and customizable.
[product_image id=1684472]
Template 15: Research and Data Collection Plan PPT Guidelines
A research and data collection plan is only useful when it communicates clearly to everyone in the room. This deck translates the planning process into a polished, boardroom-ready presentation that moves audiences from scope to methodology without confusion. Strong visual structure ensures your data collection methods and research objectives are immediately legible. The layout handles everything from client pitches to internal research kick-offs with equal confidence. You can build professional research data management plans that command credibility from the first slide. Transform your research planning presentations today. Download this dynamic template now and unlock your data collection planning potential.
[product_image id=1489816]
Template 16: Data Science Strategic Plan PPT Sample
Data science strategy is often discussed in vague terms that mean different things to different teams. This deck gives data science leads and senior analysts a structured, visually engaging way to present a concrete strategic plan to executive stakeholders. It fits planning cycles where big data analytics strategy and capability roadmaps need to be presented alongside business priorities. The clean layout keeps complex planning visible without overwhelming a non-technical audience. The template is 100% editable and customizable.
[product_image id=1407768]
Template 17: Steps to Conduct Quantitative Data Analysis PPT Designs
Quantitative data analysis is only credible when the steps are visible and defensible. This slide walks audiences through the process in a clear, sequential format that research leads and analysts can present with confidence. It's built for situations where the rigor of the methodology needs to be on display—academic reviews, client briefings, or internal audit presentations. Teams presenting a statistical modeling plan or a research methodology plan will find the structure immediately useful. The template is 100% editable and customizable.
[product_image id=1822624]
Template 18: Data Analytics Half-Year Action Plan Roadmap PPT Slides
A half-year analytics roadmap needs to show progress without overwhelming the audience with detail. This deck delivers a clean, milestone-driven layout that maps six months of analytics activity into a presentation any stakeholder can read in under two minutes. The creative design combines visual impact with functional clarity—no clutter, no confusion. You can build compelling data analysis plan roadmaps for mid-year cycles and half-year performance reviews effortlessly. Transform your short-horizon analytics presentations today. Download this dynamic template now and unlock your half-year planning potential.
[product_image id=1596760]
Template 19: Data Analytics Playbook PPT Sample
An analytics playbook is only as good as the clarity it delivers to the people using it. This deck merges structured analytics methodology with a visually compelling layout that holds attention across a full presentation. The flexible design lets you adapt tone and depth for different audiences—from technical teams to executive sponsors. Use case anchors across each section make the playbook immediately actionable for quantitative data analysis and business performance cycles. You can build high-impact analytics playbook presentations that drive team alignment and results. Transform your analytics communication today. Download this dynamic template now and unlock your playbook's full potential.
[product_image id=1539657]
Template 20: Data Analytics Dashboard for Telecom Industry PPT
Telecom analytics generates enormous data volumes, but dashboards only work when they're built for the right audience. This PPT slide gives telecom analysts and business intelligence leads a visually polished dashboard framework to present performance metrics analysis to leadership. It captures KPI trends, operational signals, and customer data patterns in one structured, scannable view. Teams running ongoing data visualization strategy reviews or monthly business intelligence plan check-ins will find this deck immediately practical. The template is 100% editable and customizable.
[product_image id=1596759]
Elevate Your Data Analysis Plan with SlideTeam
SlideTeam's PowerPoint templates are the best in the industry for building a structured, credible data analysis plan. These content-ready slides save hours of formatting time while delivering the professional clarity your stakeholders expect. Whether you're mapping a statistical analysis plan or a full business intelligence roadmap, these ready-made frameworks give you the structure to present with confidence. Deploy these PowerPoint slides to turn raw data into decisions that drive real outcomes.
FAQs on Data Analysis Plan
What are the components that all effective data analysis plans must include before any data collection begins?
Every effective data analysis plan must define its research questions or objectives first. Then specify your data sources, collection methods, and the unit of analysis. Add a section on the analytical methods you'll use and how you'll handle data quality. Finally, agree on how results will be reported and to whom. These five components—objective, source, method, quality control, and reporting—must exist before any data collection begins.
How do you determine the appropriate statistical methods for your data analysis plan based on the type of data you're working with?
Start with the type of outcome you're measuring. Categorical outcomes call for chi-square tests or logistic regression. Continuous outcomes use t-tests, ANOVA, or linear regression. If your data is non-normal or the sample is small, use non-parametric alternatives. The key decision rule is simple: let the data type and your research question determine the method—not the other way around.
What is the difference between exploratory and confirmatory data analysis, and how does each approach influence your overall plan?
Exploratory data analysis finds patterns without a pre-set hypothesis—it's open-ended and discovery-driven. Confirmatory analysis tests a specific hypothesis you formed before collecting data. Exploratory work influences your plan by expanding what you measure; confirmatory work narrows it. Most rigorous plans separate the two explicitly to avoid letting early findings bias the formal statistical tests.
How should a data analysis plan address missing data, outliers, and data quality issues discovered during the analysis phase?
Address missing data, outliers, and quality issues before analysis begins — not during it. Your plan should specify the threshold for acceptable missing data and the imputation method you'll use. For outliers, decide in advance whether you'll exclude, cap, or transform them. Document every decision. Fixing these issues mid-analysis introduces bias and makes results hard to defend.
What role does hypothesis formulation play in shaping the structure of a data analysis plan?
A hypothesis gives the plan its direction. Without one, you're collecting data without knowing what would count as a result. A well-formed hypothesis defines the variables, the expected relationship, and the direction of the effect. It then dictates which statistical test is appropriate and what sample size you need. In short, the hypothesis is the spine the rest of the plan is built around.
How do you align your data analysis plan with the specific business objectives or research questions it is meant to answer?
Start by writing the business or research question in one plain sentence. Every element of the plan—variables chosen, data sources used, methods applied—should directly serve that question. If a proposed analysis step can't be traced back to the core objective, cut it. Review the plan with a stakeholder who owns the business question before data collection starts. Alignment at that stage prevents wasted analysis later.
What are the most common mistakes analysts make when building a data analysis plan, and how can they be avoided?
The most common mistake is starting the analysis before the plan is written. A close second is defining the outcome measure after seeing the data. Analysts also frequently skip sample size calculations, assume data quality without checking it, and present findings without pre-agreed interpretation criteria. Each of these can be avoided by treating the plan as a binding document—not a formality written after the fact.
How does sample size determination impact the validity and reliability of conclusions drawn from a data analysis plan?
Sample size determines whether your study can detect a real effect when one exists. Too small a sample produces unreliable results; too large wastes resources. Calculate sample size using your expected effect size, acceptable error rates, and desired statistical power—typically 80% or higher. A plan without a sample size justification gives reviewers no basis to trust the conclusions, regardless of how clean the analysis looks.