Data analytics four quarter action plan roadmap
Try Before you Buy Download Free Sample Product
Audience
Editable
of Time
Ready to take your data analytics to the next level? Then download SlideTeam’s amazing set of data analytics powerpoint templates. These templates will give you a deep understanding of what actions you need to take in order to achieve your business goals for the upcoming quarter. With our help, you can create an actionable roadmap that will ensure success in the months ahead. So don’t wait any longer - download our templates today and get started on making this your best year yet.
People who downloaded this PowerPoint presentation also viewed the following :
Content of this Powerpoint Presentation
Description:
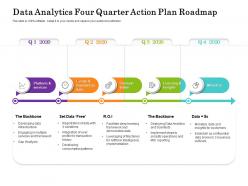
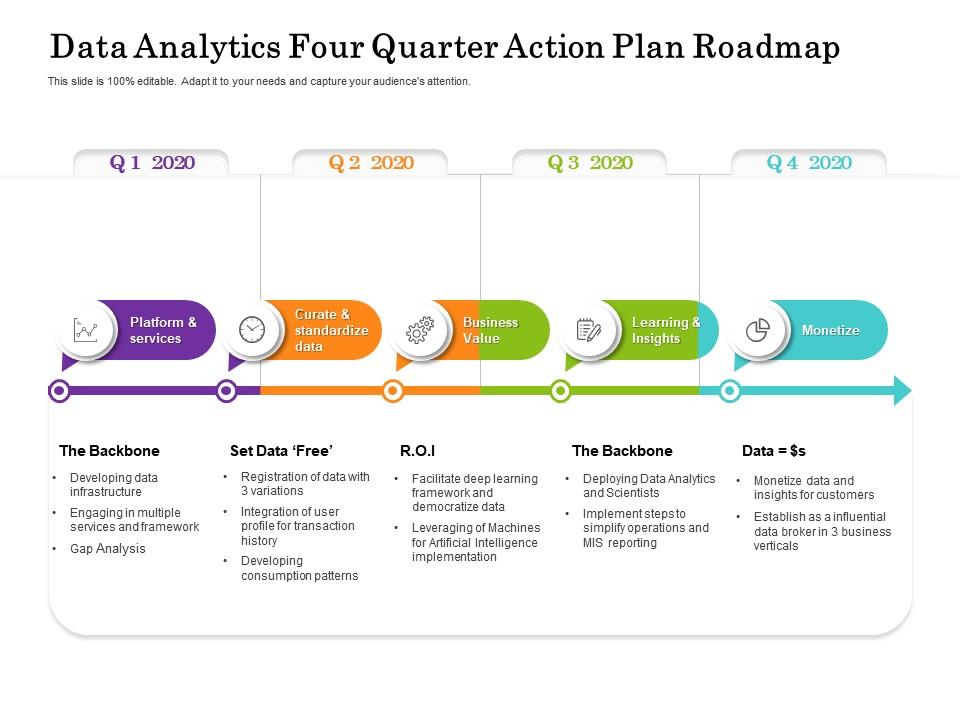
The image showcases a PowerPoint slide titled "Data Analytics Four Quarter Action Plan Roadmap," which is a strategic planning tool for laying out data analytics initiatives over the course of a year, broken down by quarters (Q1 to Q4 2020).
The slide contains the following text elements:
Each quarter is represented by a distinct phase in the data analytics journey:
Q1 2020:Â
Platform & services, focusing on developing data infrastructure, engaging in multiple services and frameworks, and conducting gap analysis.
Q2 2020:Â
Curate & standardize data, aiming to set data 'free' through registration of data with variations, integration of user profiles for transaction history, and developing consumption patterns.
Q3 2020:Â
Business Value, working on return on investment (R.O.I) by facilitating deep learning, leveraging machines for AI implementation, and democratizing data.
Q4 2020:Â
Learning & Insights, and Monetize, where the focus is on deploying data analytics and scientists, simplifying operations, and monetizing data for customers.
Use Cases:
This type of slide is applicable across a variety of industries for strategic planning and presentation of data analytics initiatives:
1. Technology:
Use: Mapping out data analytics development phases.
Presenter: Chief Technology Officer
Audience: IT department, stakeholders
2. Healthcare:
Use: Planning data management for patient care analytics.
Presenter: Healthcare Data Analyst
Audience: Hospital administrators, clinical staff
3. Finance:
Use: Outlining data strategy for financial forecasting.
Presenter: Financial Planner
Audience: Investment teams, corporate clients
4. Retail:
Use: Scheduling customer data analysis for market targeting.
Presenter: Marketing Manager
Audience: Sales teams, marketing departments
5. Manufacturing:
Use: Implementing data analytics for supply chain optimization.
Presenter: Operations Director
Audience: Supply chain managers, operational staff
6. Education:
Use: Structuring data systems for educational outcomes analysis.
Presenter: Academic Researcher
Audience: Educational administrators, policy makers
7. E-commerce:
Use: Quarterly data action plan for customer behavior analysis.
Presenter: E-commerce Strategist
Audience: E-commerce team, marketing experts
Data analytics four quarter action plan roadmap with all 2 slides:
Use our Data Analytics Four Quarter Action Plan Roadmap to effectively help you save your valuable time. They are readymade to fit into any presentation structure.
FAQs for Data analytics four quarter
So basically you've got five main steps. First, figure out what problem you're actually solving - sounds obvious but people mess this up all the time. Then comes data collection and prep, which is honestly the worst part and takes forever. After that you'll do exploratory analysis to find patterns, then modeling to get your actual insights. Last step is visualizing everything so people can understand what you found. One thing though - seriously don't skip the data cleaning phase. I know it's boring but trust me, garbage data will ruin everything downstream.
First thing - figure out what you actually need it for and what data you're working with. That alone will cut your options in half. Budget matters too, obviously. Check if your team already knows any of these tools because honestly, learning curves can be brutal. Volume and real-time stuff are big factors. Oh, and make sure it plays nice with whatever you're already using tech-wise. You don't want to be stuck with something that can't grow later. Best approach? Pick 2-3 tools and run a small test project. You'll know pretty quick which one clicks with your workflow.
Think of data governance as your safety net - without it, your whole analytics project can fall apart pretty quickly. You're setting up the rules and processes that keep your data clean and trustworthy. Skip this step and you'll hate yourself later when your insights are totally wrong because the underlying data was garbage. It also covers who gets access to what information and how to use it responsibly. I know it sounds super boring compared to building cool ML models, but trust me on this one. Map out your governance framework early. Your future self will thank you when everything actually works.
First thing - figure out what actually matters to your business and tie real numbers to it. Like if customer retention is your goal, track churn rate and lifetime value, not some BS vanity metric that looks pretty. Get different departments involved upfront so you're all on the same page about success. Pick maybe 3-4 KPIs that genuinely impact your bottom line. I've watched too many teams drown in fancy dashboards that don't actually help anything. Build your data setup around those core metrics. Honestly, start small and prove it works before going crazy with analytics.
Honestly, the worst mistake is trying to do everything at once. You'll burn out your team and probably fail spectacularly. Pick maybe 2-3 wins that'll actually make people happy and focus there first. Get everyone on the same page early too - I've watched so many projects crash because marketing wanted one thing while engineering expected something totally different. Your data's probably messier than you think, so budget extra time for cleaning that up. Oh, and don't forget people hate change, so plan for some pushback when you roll things out.
Look, pick 3-4 metrics that actually matter to your bosses and stick with them. ROI is obvious - is this stuff making money or saving costs? But here's what people forget: adoption rates are huge. Doesn't matter how brilliant your insights are if everyone ignores them. I'd also watch data quality improvements and how fast people can get answers from your dashboards. Oh, and user engagement - are they actually clicking around or just pretending to care? The trick is nailing down these success criteria before you launch anything. Otherwise you're just flying blind.
You'll definitely need a good mix of tech and business people for this. Data engineering, stats, Python/SQL skills - that stuff's obvious. But honestly? The communication side is where most teams screw up. Find people who can actually explain what the data means without making everyone's eyes glaze over. Project management is huge too since you're wrangling so many different people and deadlines. I'd probably start by figuring out what skills you already have on the team. Then decide if it's worth training people up or just hiring someone who knows this stuff already.
Build those validation checks straight into your pipeline - don't just slap them on later. Automated rules catch duplicates and missing values before they wreck everything. Trust me, I watched bad data completely destroy a quarterly report once and it was painful. Someone needs to actually own each dataset too, otherwise nobody takes responsibility. Short sentences work. Document where your data comes from so you can track down problems when they pop up (and they will). Oh, and don't let IT handle all the data quality stuff alone - that's how things fall through cracks.
Honestly, just keep it simple and think about what your audience actually needs to see. Bar charts work great for comparing stuff, line charts for trends over time. And please - go easy on the pie charts, everyone uses way too many of them. Stick with clean colors and fonts, skip the 3D nonsense that just makes things messy. Your titles and labels need to be crystal clear. Don't be afraid of white space either - it's not wasted space, it helps people focus. Here's the thing though: you're telling a story, not just throwing data at people. Figure out your main point first, then build everything around that. If someone can't get it in 5 seconds, you've overcomplicated it.
Know your audience - execs want bottom line impact, tech teams want the nitty-gritty details. Charts beat spreadsheets every time (seriously, nobody wants another data dump). Tell a story: problem, findings, then what to do about it. Always start with "so what" before getting into "how." Oh, and definitely have backup slides ready. Someone will ask that one random question you didn't prep for - they always do. Keep it visual and conversational. You've got this!
So you know how GPS recalculates when you take a wrong turn? That's basically what feedback loops do for your data - they stop your analytics from going completely off the rails. You gotta check how your predictions are actually playing out in real life, then tweak your models based on what you find. Otherwise you're just making educated guesses that get worse over time. I'd honestly start small though - pick one metric and track it weekly to see if you're on target. The whole point is catching drift before your insights become useless.
Business impact first, always. Go after stuff that's actually costing money or driving people crazy. Quick wins early on will save your ass later when you pitch the big stuff. Honestly, I'd rather see basic reporting done well than some fancy ML project that falls apart. Your team's skills matter too - don't bite off more than you can chew with crappy data. Simple scoring works: impact vs effort. Cut everything else ruthlessly. Revenue-moving projects only.
Honestly, start with cloud infrastructure - way cheaper than dealing with server headaches later. I learned that the hard way lol. Standardize your data pipelines too so you're not recreating the wheel constantly. Train people on self-service tools like Tableau or Power BI early. Super important to get data governance sorted upfront, even though it's boring as hell. Oh, and automate those repetitive reports first - you'll actually have time for the interesting analysis instead of cranking out the same monthly dashboards forever.
Start with predictive stuff on whatever clean data you already have - customer churn, demand forecasting, that kind of thing. Most companies get way too ambitious right off the bat, but you're in good shape if your data's solid. I'd automate the boring analysis work first, then dive into pattern recognition for anomaly detection or recommendations. Don't overthink it - ML should build on what you're doing now, not replace everything. Pick one use case that'll actually move the needle, prove it works, then expand from there.
Okay so privacy and consent stuff - super important to nail down right from the start. Be upfront about what data you're grabbing and why. Your datasets will probably have bias baked in (happens to everyone, don't stress), but you've gotta watch for it. Think hard about whether your analysis might screw over certain groups unfairly. Just because the data's there doesn't mean you should analyze it, you know? I always ask myself "is this actually ethical?" before I get distracted by all the cool technical possibilities. Honestly saves me headaches later.
-
Very well designed and informative templates.
-
Very well designed and informative templates.
-
Top Quality presentations that are easily editable.