


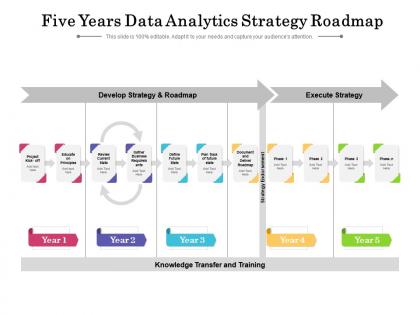
Five years data analytics strategy roadmap




Try Before you Buy Download Free Sample Product
 Impress Your
 Audience
 100%
100% Editable
 Save Hours
 of Time


SlideTeam’s data analytics templates can help you get started on your own data analytics journey. Our templates are easy to use and provide a roadmap for developing a successful data analytics strategy. With our templates, you can start thinking about the questions you need to ask in order to get insights from your data. Download them now and see how they can help you achieve success with your data analytics initiatives.
People who downloaded this PowerPoint presentation also viewed the following :
Five years data analytics strategy roadmap with all 2 slides:
Use our Five Years Data Analytics Strategy Roadmap to effectively help you save your valuable time. They are readymade to fit into any presentation structure.
FAQs for Five years data
Honestly, start by figuring out what business questions you're actually trying to solve - that's your north star. Map out what data you currently have (and trust me, it's probably messier than you think). The infrastructure piece is honestly the worst part but you can't skip it. After that, pick your tools and build out the actual analytics capabilities. Oh, and don't treat governance like an afterthought - bake it in from day one. I'd sketch out where you are now vs where you want to be in about 18 months, then work backwards from there.
Honestly, just map out what you actually need first - your data sources, use cases, all that. Don't get distracted by flashy demos (been there lol). Budget matters obviously, plus think about your team's tech skills. Do you need self-service stuff or more complex modeling? Integration with existing tools is huge too. Here's what I'd do - pick 2-3 options and run small pilots with your real data before deciding anything. Way better than guessing based on sales pitches. Oh and consider how fast you'll need to scale up.
Look, you HAVE to set measurable goals first or you'll get totally lost in the data weeds. I made this mistake once - spent forever analyzing random customer patterns when I should've been focused on actual conversions. What a waste. Measurable goals help you figure out which metrics actually move the needle and keep you from burning through budget on pointless analysis. Plus stakeholders need to see real ROI, not just pretty charts. Pick 2-3 specific outcomes you want to hit in the next few months. Trust me on this one.
Honestly, stakeholder engagement is what makes or breaks your roadmap priorities. You want different departments involved from the start - they'll tell you which analytics actually solve real problems instead of just sounding impressive. I've watched so many teams build roadmaps alone and then wonder why nobody uses them! Regular check-ins keep everyone on the same page too. Your stakeholders know which data sources you can realistically access, what timelines work for their teams, and they'll help define metrics that actually matter. Plus you need their buy-in to get resources anyway.
Look, data governance is what makes your analytics actually worth something. No governance? Your data quality's gonna be all over the place, teams won't trust anything, and you'll spend forever arguing about whose numbers are correct. Good governance means clear ownership, quality standards, and knowing who can access what. Not the fun part of analytics, I'll give you that - but it's what separates companies that actually use their data from ones just pretending to. I'd start simple: document your most important data sources first and figure out who owns each one.
Honestly, just make a simple scoring system - business impact vs how much work it'll take. Go for the high-impact stuff that won't kill your team first. Revenue, cost savings, customer happiness - that's what the C-suite actually gives a shit about. I've watched so many teams get distracted by flashy AI projects that look cool but don't actually make money. Quick wins are everything because they prove you're not just burning budget. Oh, and don't forget your data's probably messier than you think, so factor that into your effort estimates. ROI timelines will save your ass when budget reviews come around.
Honestly, getting leadership on board first is huge - without that you're basically dead in the water. Make sure everyone can actually access the data, not just your analysts. Most people are genuinely scared of numbers (can't blame them), so you'll need some basic training sessions. Dashboard setup for each department helps a ton. We always did weekly data check-ins to keep momentum going. Oh, and definitely celebrate when someone makes a good call based on the data - people remember that stuff. I'd pick one department to pilot with rather than going company-wide immediately. Once you've got some wins under your belt, expansion becomes way easier.
Look at five main things: your data quality, tech setup, governance, analytics skills, and whether decisions actually use data. Most companies totally overestimate where they stand, tbh. Start with an audit - what data do you collect, is it clean, can people access it easily? Check your tech stack too. Are you running on ancient systems or modern tools? Survey your teams about frustrations and see if they're really using data for decisions or just creating reports nobody reads. That's always telling. Build a simple scorecard from there and you'll have a solid starting point for improvement.
You need SQL people for sure, plus someone good with Python or R. Data viz is huge too - Tableau skills are worth their weight in gold. But here's the thing that trips up most teams: communication matters just as much as the technical stuff. Your analysts have to turn all those complex findings into stories that actually make sense to the business folks. Industry knowledge helps a ton too - context makes all the difference when you're looking at numbers. I'd start by figuring out what skills your current team's missing, then tackle the biggest gaps first.
Wait until your data house is actually in order first - clean pipelines, decent governance, basic analytics working. Then start small with predictive stuff that actually matters to your business. Skip the flashy deep learning for now (seriously, I've watched teams crash and burn doing this). Automated reporting and spotting weird anomalies? Perfect starting points. Your team can level up gradually from there. The whole point is finding problems where ML beats simple rules - like when patterns get too messy for humans to catch easily.
Honestly, define what you actually want to achieve before you even look at data - I've watched so many projects crash because they skipped this part. Clean data matters way more than people think. Fancy algorithms won't save you if your input is trash. Get leadership on board early, not just the tech people. Your team needs constant training since everything changes constantly. Oh, and start small! Run a pilot project first to show it actually works. Way better than blowing your whole budget on something that might flop. Once you prove value, then you can scale up with confidence.
Check for duplicates, missing stuff, and weird outliers right when data comes in - don't wait. I learned this the hard way after spending hours debugging garbage data that could've been caught upfront. Automated tests are your friend here, they'll flag problems before you even start analyzing. Write down what cleaning steps you did so teammates aren't totally lost. Short sentences work. Also track where your data came from so you can hunt down issues later. Basically build these checks into your normal workflow instead of scrambling to fix things afterward.
Start with the business stuff that actually matters - did you move revenue or cut costs? Whatever your project was supposed to impact. Also track if people are using your dashboards because I've seen so many beautiful reports just collecting digital dust. How fast are teams making decisions now vs before? That's huge. Data quality improvements matter too, plus you should ask stakeholders if they're happy with what you're giving them. Honestly though, pick maybe 3-4 metrics to start. You can get fancy with tracking later once you've got the basics down.
Start with modular dashboards instead of those rigid reports everyone builds. Watch leading indicators - customer behavior shifts, what competitors are doing. Most companies are totally stuck analyzing last quarter's data while the market's already moved on (drives me crazy honestly). Set up automated alerts for weird spikes or drops. Pick 3-4 core metrics that'll matter no matter what happens, then you can swap in trend-specific ones as things change. Schedule regular team reviews too. The flexibility piece is huge - you don't want to rebuild everything when markets shift.
Honestly, start by thinking about what your audience actually needs - not what'll make you look smart. One insight per chart, that's it. Don't go crazy with colors unless they mean something (though yeah, make it look decent). Bar charts and line graphs exist for a reason - they just work. Lead with the story first. What's the point that actually matters to them? I swear, less is always more with this stuff. Oh, and test it on someone random who wasn't involved in making it. If they're confused, you need to simplify. Trust me on that one.
-
Design layout is very impressive.