





 0 Comment
 Customer Reviews

The audit's done. Someone printed the results and left them on the table.
Fourteen pages of where the engineering org actually is versus where it thinks it is. Gap after gap. CI/CD pipelines that exist on paper. Automation that's technically running but nobody trusts. Teams that say "DevOps" and mean "we deployed something last Tuesday."
The problem isn't that the findings are wrong. They're probably right. The problem is the next meeting—where someone has to stand up and explain what the maturity model actually shows, what level the organization is at, and why moving from ad-hoc deployments to something resembling a continuous delivery pipeline takes longer than anyone wants to admit.
DevOps maturity assessments make people uncomfortable in a specific way. It's not the technical findings. Engineers know the state of the code. The discomfort lives in the room where you're showing a leadership team that "we have DevOps" and "we do DevOps well" are two very different statements. One is a job title. The other is a score on a framework nobody agreed to publicly.
And then there's the presentation itself. The maturity model has five stages. The audience has fifteen minutes. The gap between what needs to be said and what can be shown on a slide—clearly, without losing the thread—is where most of these conversations fall apart.
So the templates exist. Not because DevOps maturity is hard to understand—it's actually fairly clear once you've seen the framework—but because the gap between knowing your level and making leadership believe it, act on it, and fund the next stage is where things stall. Someone had to build the slides for that gap.
SlideTeam's DevOps maturity model templates handle exactly this. Pre-designed frameworks that carry the structure—maturity stages, capability assessments, DORA metrics dashboards, transformation roadmaps—so you can focus on the conversation instead of building another slide from scratch at 11pm.
Here's what's in the collection.
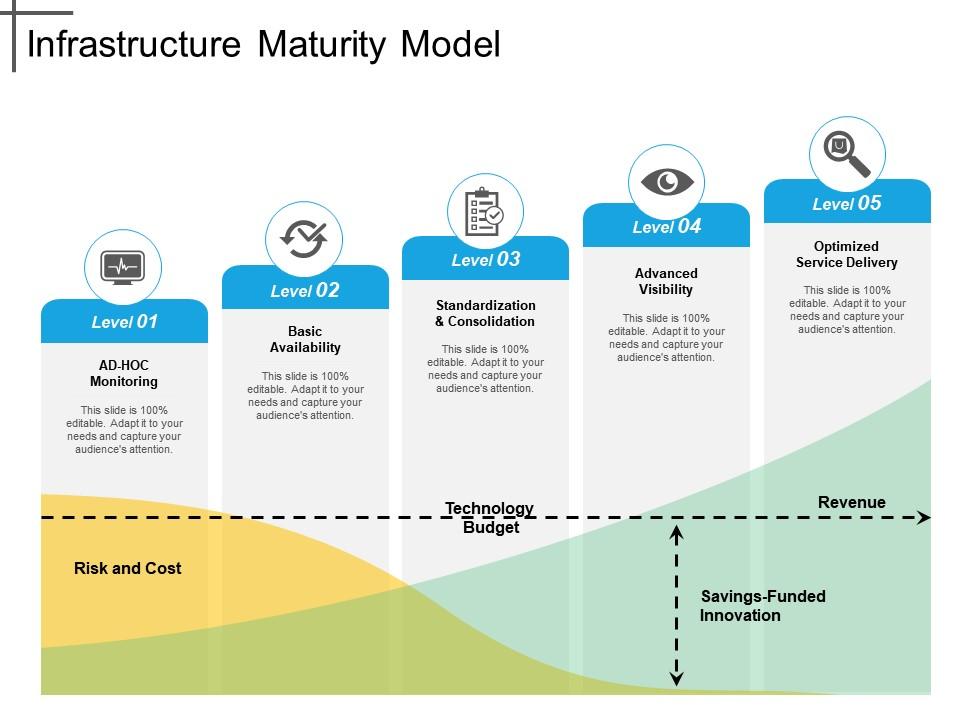
Template 1: Infrastructure Maturity Model
Infrastructure maturity is often where DevOps assessments start — and stall. This PPT template gives practitioners a clear, node-based visual to map where IT operational maturity currently sits. Engineers and IT leads reach for this slide when presenting infrastructure readiness to leadership. It works well in DevOps adoption roadmap reviews, where current state needs to sit alongside the target state. The template is 100% editable and customizable.
Download this PowerPoint Template
Template 2: MLOps Process Lifecycle Maturity Model
MLOps and DevOps maturity rarely get discussed on the same slide — this PPT template fixes that. This deck maps five MLOps lifecycle levels, from no MLOps through training automation to full MLOps automation. Data engineering leads and ML platform teams use it to show where model deployment practices sit relative to DevOps capability framework benchmarks. It fits neatly into platform engineering maturity reviews. The template is 100% editable and customizable.

Download this PowerPoint Template
Template 3: DevOps Maturity Assessment PowerPoint PPT Bundles
A DevOps maturity assessment covers a lot of ground; a 22-slide bundle handles the full scope. This PPT preset gives teams a structured, multi-slide framework to present DevOps benchmarking findings to varied audiences. Engineering managers and transformation leads use it for board-level DevOps implementation stages reviews. It works across culture, process, toolchain, and delivery dimensions without losing coherence. The template is 100% editable and customizable.
[product_image id=1127226]
Template 4: DevOps Operations Infrastructure Three Months Maturity Roadmap
Three months is a real planning horizon for DevOps operations changes — this slide makes it visible. This PPT template lays out a phased infrastructure maturity roadmap across a 90-day window. Explore more DevOps maturity model PPT templates with samples and examples to complement this roadmap view. Program managers and DevOps leads use it to align stakeholders on sprint-level delivery milestones. The template is 100% editable and customizable.

Download this PowerPoint Template
Template 5: DevOps and Cloud Security Introduction and Maturity Model
Cloud security and DevOps maturity are increasingly inseparable — this PPT template connects both. The slide walks through four stages: Non Cloud Native, Basic Cloud Security, and Cloud Native Security, among others. DevSecOps leads and cloud architects reach for this deck when presenting a DevSecOps maturity model to risk and compliance audiences. It gives a fast, clear read on where security posture sits within the DevOps lifecycle. The template is 100% editable and customizable.

Download this PowerPoint Template
Template 6: DevOps Maturity Model
A clean, five-stage DevOps maturity model is still the clearest way to anchor a transformation conversation. This PPT slide covers the core progression through Maturity Model, CMM, and Continuous Improvement levels. Agile DevOps transformation leads use it when the audience needs the framework explained before the assessment findings land. It is direct, uncluttered, and easy to build on in a longer deck. The template is 100% editable and customizable.

Download this PowerPoint Template
Template 7: Adopting DevOps Maturity Model DevOps Application Life Cycle Management
Moving from intent to adoption is where most DevOps programs lose momentum. This PPT template maps five adoption stages — Initial, Managed, Defined, Measured, and Optimized — for DevOps application lifecycle management. It is built for program directors presenting DevOps implementation stages to executives who track progress quarterly. The structured layout makes it easy to mark current position and show what the next stage requires. The template is 100% editable and customizable.

Download this PowerPoint Template
Template 8: Key Stages for DevOps Team Transformation Maturity Model
Team transformation in DevOps is harder to visualize than toolchain changes — this slide makes it concrete. This PPT preset maps key stages — Initial, Managed, Defined — for DevOps team maturity progressions. HR leads and engineering managers use it during Agile transformation roadmap reviews to show people-side progress alongside technical metrics. It keeps the conversation grounded in observable team behaviors, not abstract culture statements. The template is 100% editable and customizable.

Download this PowerPoint Template
Template 9: DevOps Maturity Levels and Their Business Benefits PPT Summary
Business benefits get lost when maturity levels are presented without context — this deck prevents that. This PPT slide connects each DevOps maturity level to its corresponding business outcome, making the case for continued investment. CTOs and DevOps sponsors use it in boardroom and client pitch settings where ROI framing matters as much as technical progress. It bridges the gap between engineering metrics and business impact clearly. The template is 100% editable and customizable.
[product_image id=1730235]
Template 10: How to Apply Tuckman's Model for Effective Team Building PPT Demonstration
Tuckman's model explains why DevOps team dynamics shift at each maturity stage. This PPT preset applies the Forming-Storming-Norming-Performing framework to DevOps cultural transformation conversations. HR leads and engineering coaches use it when team behavior — not tooling — is the bottleneck in a maturity progression. It gives structure to discussions that otherwise stay vague. The template is 100% editable and customizable.
[product_image id=1779931]
Template 11: Strategic Cloud Native DevOps Maturity Matrix
Cloud-native transitions require a maturity lens that covers more than just infrastructure. This matrix captures current status across culture, design, process, maintenance, and delivery dimensions simultaneously. It helps DevOps leads move organizations from Waterfall through Agile toward fully cloud-native operations in a structured way. Each stage gives teams a clear benchmark to assess against. Transform your cloud-native DevOps assessments with this multi-dimension view today. Download this dynamic template now and unlock sharper transition planning.
[product_image id=1131987]
Template 12: Assessing DevOps Maturity Using Key Industry Metrics PPT Mockup
Measuring DevOps maturity without industry benchmarks produces findings nobody believes. This PPT deck is built for teams presenting key industry metrics alongside their own DevOps KPI metrics to leadership. See more DevOps maturity assessment templates with examples and samples to extend this benchmarking view. Engineering directors and QA leads use it to make DevOps benchmarking framework comparisons credible and actionable. The template is 100% editable and customizable.
[product_image id=1620859]
Template 13: DevOps Maturity Assessment for Analyzing DORA Metrics Dashboard
DORA metrics are the closest thing DevOps has to a shared scoreboard. This PPT slide presents deployment frequency, lead time for changes, change failure rate, and related elements in a dashboard format. DevOps leads and site reliability engineering teams use it to track software delivery performance against high-performing team benchmarks. It turns abstract maturity claims into measurable, comparable data points. The template is 100% editable and customizable.
[product_image id=1127283]
Template 14: DevOps Maturity Five Stages Explained Clearly PPT Designs
Five-stage DevOps maturity frameworks only work when each stage is explained clearly and without jargon. This deck presents each stage with enough visual structure for mixed audiences — technical leads and business stakeholders alike. It fits into DevOps capability framework presentations where clarity across levels matters more than depth at any single stage. From boardroom reviews to team workshops, this PPT holds up across contexts. The template is 100% editable and customizable.
[product_image id=1601496]
Template 15: DevOps Maturity Culture Automation and Collaboration PPT Sample
Culture, automation, and collaboration are the three pillars that determine real DevOps maturity. This deck addresses all three together rather than treating them as separate tracks. It delivers a cohesive view of DevOps cultural transformation alongside process and toolchain dimensions. DevOps coaches and transformation leads use it when the audience needs to see how these pillars interact, not just how they're individually measured. Transform your DevOps culture presentations with this integrated perspective. Download this dynamic template now and unlock a clearer path to organizational alignment.
[product_image id=1730234]
Template 16: DevOps Maturity Assessment Dashboard PPT Designs
A dashboard format makes DevOps maturity assessment findings easier to act on. This PPT preset consolidates assessment outputs into a single, visual summary that leadership can read quickly. DevOps program managers and CIOs use it when reporting maturity progress across multiple teams or business units. It keeps findings from getting buried in slide-by-slide detail. The template is 100% editable and customizable.
[product_image id=1596885]
Template 17: Maturity Framework for DevOps Implementation in Organization
Org-wide DevOps adoption has a different challenge than team-level adoption — scale changes everything. This PPT slide maps five maturity stages from ad-hoc through proof-of-concept to org-wide adoption and sustained, repeatable DevOps. It is built for transformation leaders presenting an Agile DevOps transformation case to senior leadership or a board. The staged structure makes investment asks easier to frame and justify. The template is 100% editable and customizable.
[product_image id=1174320]
Template 18: DevOps Evolution Trends Shaping Modern Software Development PPT Summary
DevOps is still evolving — teams need a slide that reflects where software development trends are heading. This PPT deck covers the evolution of DevOps practices, from early CI/CD maturity levels through modern platform engineering and continuous testing maturity. Engineering leads and technology strategists use it in forward-looking presentations to set context before a maturity assessment. It grounds trend conversations in real delivery implications. The template is 100% editable and customizable.
[product_image id=1601495]
Template 19: Four Major Levels of Cloud DevOps Maturity Model
Cloud DevOps maturity has its own progression — Reactive, Proactive, Autonomous, Self Healing — and each level demands different investments. This PPT template maps those four stages alongside cloud strategy, DevOps assessment, pipelines, and business agility dimensions. Cloud transformation leads use it when presenting a DevOps adoption roadmap that ties infrastructure decisions to business outcomes. It makes the cloud-DevOps maturity link explicit and easy to present. The template is 100% editable and customizable.

Download this PowerPoint Template
Template 20: DevOps Strategic Maturity Model of Organization
Organizational DevOps maturity is ultimately about value delivery, not just process compliance. This PPT slide walks through five stages — Collaboration, Continuous Delivery, and Value among them — for a strategic view of where an organization sits. Senior leaders and DevOps sponsors use it when the conversation needs to move from technical metrics to business value and cultural alignment. It connects DevOps process optimization to outcomes leadership actually cares about. The template is 100% editable and customizable.

Download this PowerPoint Template
Elevate Your DevOps Maturity Conversations with SlideTeam
SlideTeam's PowerPoint templates are the best in the industry for presenting DevOps maturity model assessments with clarity and authority. These content-ready slides cover every stage — from initial adoption through optimized, autonomous delivery — saving hours of build time. Use these PowerPoint slides to communicate DORA metrics, transformation roadmaps, and capability frameworks that leadership actually acts on. Grab these ready-made templates and turn your next DevOps assessment into a decision-driving presentation.
FAQs on DevOps Maturity Model
What are the key stages in a DevOps maturity model, and how do organizations typically progress through them?
Most DevOps maturity models use five stages: Initial (ad-hoc), Managed (repeatable), Defined (standardized), Measured (data-driven), and Optimized (continuous improvement). Organizations progress by tackling one layer at a time — usually starting with CI/CD pipelines, then culture, then measurement. Movement is rarely linear. Teams often advance technically before cultural practices catch up.
How can teams objectively assess their current position within a DevOps maturity framework?
Use a structured DevOps maturity assessment against a defined capability framework — covering deployment frequency, lead time, change failure rate, and team collaboration. DORA metrics give the most objective read. Supplement with team surveys to catch cultural gaps that tooling data misses. Avoid self-reporting without evidence; it consistently overstates maturity.
What distinguishes a Level 3 DevOps organization from a Level 5 in terms of automation and cultural practices?
A Level 3 organization has defined, repeatable processes and working CI/CD pipelines. A Level 5 runs fully automated deployments, self-healing infrastructure, and blameless post-mortems as standard practice. The biggest gap is cultural: Level 5 teams treat failure as a learning signal, not an incident to assign blame for.
Which metrics best indicate that an organization has achieved advanced DevOps maturity?
The four DORA metrics are the clearest indicators: deployment frequency, lead time for changes, change failure rate, and time to restore service. Elite performers deploy multiple times per day with recovery times under one hour. These DevOps KPI metrics are measurable, comparable, and directly tied to business delivery outcomes.
How does continuous integration frequency correlate with an organization's overall DevOps maturity level?
Higher continuous integration frequency consistently tracks with higher DevOps maturity. Teams at early stages integrate weekly or less; mature teams integrate multiple times daily. Frequent integration forces automation, fast feedback, and cultural trust in the pipeline. Low CI frequency is one of the clearest early-stage signals in any DevOps benchmarking framework.
What role does organizational culture play in advancing through DevOps maturity stages compared to tooling choices?
Culture is the harder constraint. Teams can buy tools in a week; changing how engineers and managers respond to failure takes months. Tooling unlocks capability — culture determines whether teams actually use it. Organizations that invest only in tooling typically plateau at Level 3, unable to move further without addressing collaboration and psychological safety.
How do siloed teams hinder progress in a DevOps maturity model, and what structural changes accelerate advancement?
Siloed teams create handoff delays, slow feedback loops, and accountability gaps — all of which cap maturity at the early stages. Structural fixes that work: shared on-call rotations, cross-functional product teams, and joint ownership of deployment pipelines. Embedding operations knowledge into development teams removes the most common handoff bottleneck.
What are the most common bottlenecks that prevent organizations from moving beyond the initial stages of DevOps maturity?
The three most common blockers are: manual deployment processes that teams never automate, lack of leadership support for blameless culture, and no agreed measurement baseline. Without baseline DevOps KPI metrics, teams can't demonstrate progress — so investment stalls. Fix measurement first; it makes every other conversation easier.