





 0 Comment
 Customer Reviews

The deck's been sitting in the shared drive for a week. Everyone knows it exists. Nobody's touched it.
Not because the work isn't done—it probably is. But somewhere between "we're innovating" and "here's proof we're innovating," there's a gap that's uncomfortable to cross. Numbers exist. Experiments happened. Products launched. But converting all of that into something a leadership team or board can actually read? That's the part nobody wants to start.
Innovation measurement is awkward for a specific reason. It's not like revenue. Revenue either came in or it didn't. Innovation sits in this murky middle—ideas that didn't convert, R&D spend that looks wasteful until it isn't, timelines that slipped because the market moved. And when someone asks "how do we know it's working," the honest answer is usually "it depends," which isn't what anyone in that room wants to hear.
So people default to activity metrics. Number of patents filed. Number of workshops run. Hours spent in ideation sessions. These feel like progress because they're countable. But they don't tell you whether the innovation is actually producing anything—whether product development metrics are trending right, whether the pipeline has real commercial weight, or whether R&D productivity is translating into outcomes.
The harder question—and the one most decks avoid—is whether your innovation is generating business value. Not just ideas. Value. And building a presentation around that question requires a structure most people don't have sitting in their heads, ready to go.
That's why these templates exist. Not to replace the thinking, but to give it a shape. SlideTeam's innovation metrics templates are pre-designed for exactly this situation—when you know what you're measuring but can't figure out how to show it. Ready-made frameworks that handle the structure so you can focus on the substance.
What follows are twenty templates worth looking at.
Template 1: Operational Performance Metrics Covering Project Management Innovation
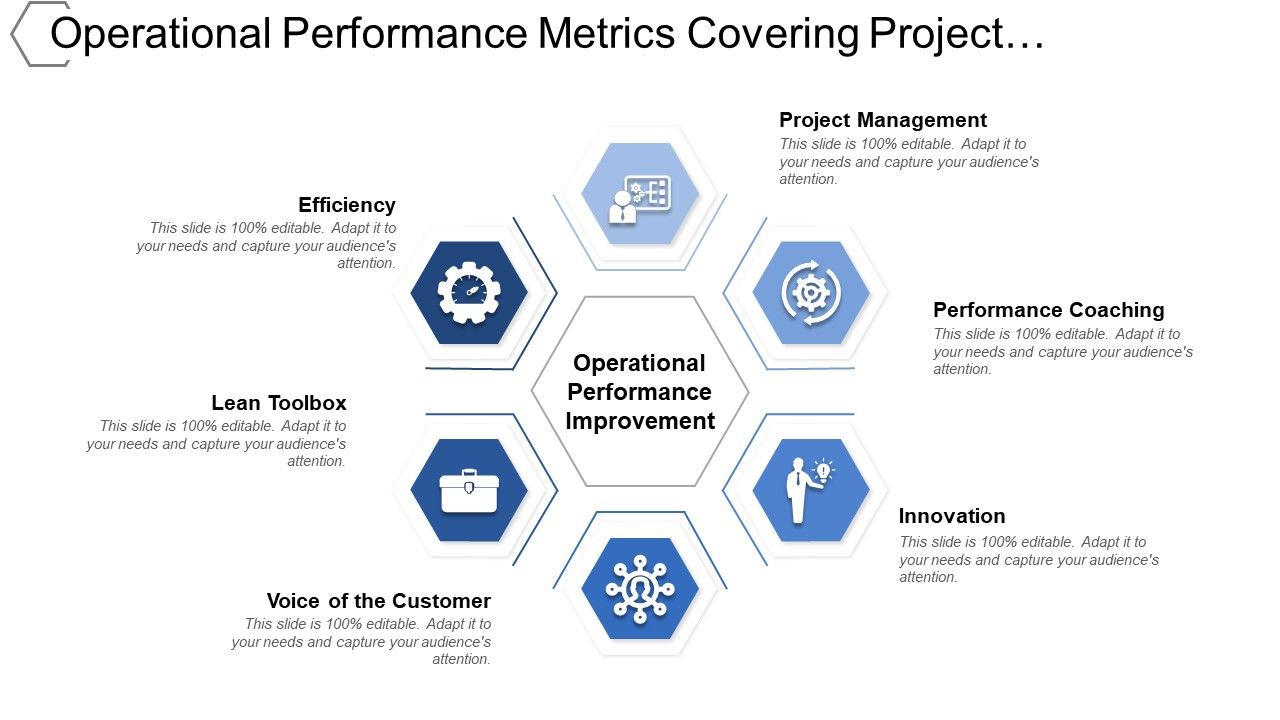
Operational performance rarely sits in one tidy place—it cuts across projects, teams, and timelines simultaneously. This PowerPoint slide is built for operations leads and project managers who need to report innovation KPIs alongside execution data in one view. It maps a six-stage process, connecting operational performance metrics to project management innovation outputs. Use it to present business innovation KPIs to leadership without losing the operational context. The template is 100% editable and customizable.
Download this PowerPoint Template
Template 2: Innovation Roadmap Timeline Showing Financial Reforms Usage Metrics
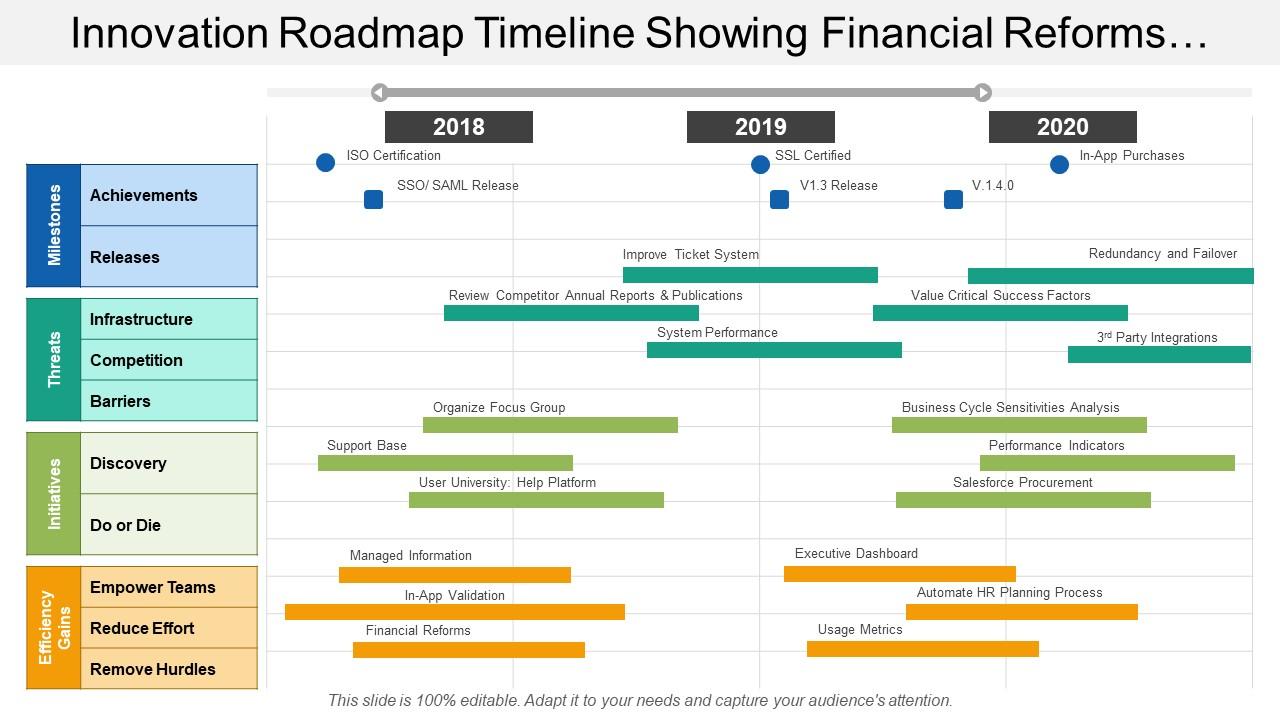
Financial reforms and innovation timelines don't often appear in the same visual—this PPT bridges that gap clearly. Strategy leads and finance teams reach for this slide when they need to show how innovation investments map to milestone-based progress. The three-stage roadmap structure ties usage metrics directly to reform phases, making R&D measurement conversations easier to anchor in time and budget. It works well in quarterly reviews and investor briefings alike. The template is 100% editable and customizable.
Download this PowerPoint Template
Template 3: Innovation Portfolio Management Metrics Dashboard
Managing an innovation portfolio means tracking many moving parts—funnels, success rates, and active projects—without losing sight of the whole. This PPT template surfaces those layers in a single dashboard view, covering value in pipeline, finished projects, and total active projects. Portfolio managers and innovation leads use it to run honest reviews of what's progressing and what's stalled. For a deeper look at how these metrics connect, explore SlideTeam's innovation metrics templates and examples. The template is 100% editable and customizable.
[product_image id=1206813]
Template 4: Innovation Metrics and KPIs for Effective Innovation Management PPT Information
Not every innovation management conversation fits a standard format—this PPT preset handles the messier, more nuanced briefings. It's built for innovation managers and department heads who need to present KPIs alongside qualitative context. The deck covers both input and output metrics, giving teams a grounded way to discuss what's working and what needs adjustment. It fits naturally into innovation scorecard reviews and cross-functional planning sessions. The template is 100% editable and customizable.
[product_image id=1802764]
Template 5: Innovation Funnel Metrics and KPIs PPT Guidelines
Funnel clarity drives better innovation decisions. This deck maps every stage of your innovation funnel with precision, translating complex pipeline data into compelling visual narratives. Color-coded KPI sections deliver instant visibility across ideation, development, and launch phases. You can align each funnel stage to your organization's specific innovation performance indicators with ease. Build persuasive innovation pipeline reviews that drive resource allocation decisions confidently. Transform your funnel presentations today. Download this dynamic template now and unlock sharper innovation tracking across your entire portfolio.
[product_image id=1514874]
Template 6: Innovation Metrics Measuring Success and ROI PPT Slides
Measuring innovation ROI is one of those things that sounds straightforward until you actually try to do it. This slide is built for teams who need to show the commercial return on innovation investments without oversimplifying the picture. It supports conversations around innovation outcome measurement—connecting spend, activity, and results in one readable view. Finance leads and innovation heads both reach for this PPT when the board asks for proof of return. The template is 100% editable and customizable.
[product_image id=1495118]
Template 7: Measuring Innovation Success Metrics That Matter PPT Summary
Captures the metrics that actually matter for innovation success—not just activity counts, but outcomes. This deck translates complex innovation performance data into crisp, audience-ready visuals that build immediate credibility. Flexible creative layouts let you align each slide to your organization's specific innovation benchmarking framework. Present innovation success factors clearly, whether for a board review or a cross-functional team debrief. Transform how your organization sees and measures innovation today. Download this dynamic template now and make every metric count.
[product_image id=1464325]
Template 8: Innovation Metrics Framework for Growth Companies PPT Structure
Growth companies need innovation metrics that scale with them—not frameworks built for mature enterprises. This deck delivers a structured approach to startup growth metrics and innovation health tracking that stays relevant as the business evolves. Customizable layouts let you adjust each KPI view to match your current stage and reporting audience. Present your innovation framework confidently to investors, leadership, or the board. Transform your growth-stage innovation reporting today. Download this dynamic template now and build a metrics foundation that grows with your company.
[product_image id=1845510]
Template 9: Measure Phase Metrics and Data Collection PPT Slides
Measurement before action is what separates guesswork from grounded decisions. This deck structures the measure phase of any improvement or innovation cycle, combining metric selection with data collection planning in one coherent flow. Strong visual hierarchy guides your audience from problem definition through data analysis without losing momentum. You can adapt each section to fit product development metrics reviews or digital transformation measurement programs. Transform your measurement presentations today. Download this dynamic template now and give your data collection process the structure it deserves.
[product_image id=1665635]
Template 10: Innovation Metrics from Idea to Market Impact PPT Information
Getting an idea to market is a long chain of decisions—this deck maps the full journey from concept through commercial impact. Elevates innovation tracking by giving each stage of the idea-to-market process its own clear visual anchor, so nothing gets lost in the telling. Audience-specific color themes let you adapt the narrative for R&D teams, product leads, or executive sponsors. You can present new product launch metrics with confidence and contextual depth. Transform your innovation journey presentations today. Download this dynamic template now and show the full value of your pipeline.
[product_image id=1845511]
Template 11: Innovation Metrics Quantitative Measures of Innovation Performance PPT Graphics
Quantitative rigor separates credible innovation reporting from optimistic storytelling. This deck gives teams a structured way to present quantitative measures of innovation performance—input ratios, output counts, and efficiency indicators—without reducing the narrative to a spreadsheet. Polished visual treatments make complex R&D productivity data persuasive rather than overwhelming. You can build comprehensive innovation performance reviews that resonate with both technical and non-technical stakeholders. Transform your quantitative innovation presentations today. Download this dynamic template now and make your numbers work harder.
[product_image id=1802765]
Template 12: Innovation Metrics Input Process Output Outcome PPT Mockup
Input-to-outcome thinking is how serious organizations track whether innovation is actually working. This deck structures that chain clearly—from inputs through process, output, and outcome—giving teams a logical framework to present innovation efficiency indicators at any level. Creative layouts let you map the full innovation value chain without losing your audience in complexity. Present process-driven innovation reviews with clarity and professional polish. Transform your input-to-outcome presentations today. Download this dynamic template now and give your innovation reporting a framework that holds up to scrutiny.
[product_image id=1845512]
Template 13: Innovation Dashboard Snapshot with Key Metrics PPT Designs
Dashboard snapshots let leadership see innovation health in seconds, not after ten slides of context. This deck delivers a visually striking innovation dashboard that combines key metrics into one commanding view—ideal for boardroom presentations and executive briefings. Creativity and functionality merge to ensure your KPIs land clearly without visual noise. You can customize each metric panel to reflect your organization's innovation index priorities. Transform your innovation dashboard presentations today. Download this dynamic template now and give decision-makers the clarity they need instantly.
[product_image id=1832804]
Template 14: Innovation Process Metrics and KPIs PPT Outline
Process metrics matter because innovation rarely fails from lack of ideas—it fails from poor execution tracking. This PPT deck is built for innovation managers and operations leads who need to report on process-level KPIs clearly and consistently. It handles everything from stage-gate metrics to cycle time reviews, making it practical for both quarterly reporting and project retrospectives. Use it when the conversation is about where the process is slowing down, not just what the output looks like. The template is 100% editable and customizable.
[product_image id=1560666]
Template 15: Innovation Metrics Measuring Business Success PPT Outline
Business success doesn't explain itself—someone has to show the connection between innovation activity and commercial outcomes. This slide is designed for leaders who need to present that link without losing the room to jargon or abstract frameworks. It covers the measurement side of innovation management, giving teams a clean structure for business growth KPIs tied to innovation programs. It works equally well for internal reviews and external stakeholder briefings. The template is 100% editable and customizable.
[product_image id=1845513]
Template 16: How to Measure Innovation with Effective Metrics PPT Structure
Knowing you should measure innovation and knowing how to do it are two different problems. This deck addresses the second one directly, giving teams a step-by-step visual structure for building an effective metrics approach from scratch. Crisp layout design ensures each measurement method is presented with the clarity needed for buy-in from non-specialist audiences. You can adapt the flow for technology adoption rate reviews or broader digital transformation metrics programs. Transform how your organization approaches innovation measurement today. Download this dynamic template now and build a metrics practice that sticks.
[product_image id=1845375]
Template 17: Measuring Impact through Quantifiable Accomplishment PPT Designs
Quantifiable accomplishment is what turns good work into a defensible record—this PPT preset helps make that case clearly. It's built for teams who need to move beyond anecdotal evidence and show measurable impact to leadership or external stakeholders. The deck handles impact measurement across multiple dimensions, making it useful for both innovation-specific reviews and broader performance reporting. Program leads and strategy teams reach for this slide when the conversation turns to proof. The template is 100% editable and customizable.
[product_image id=1625259]
Template 18: Measuring Success Analytics and KPIs PPT
Success means different things to different teams—this PPT preset gives practitioners a structured way to define and track it across analytics and KPIs in one cohesive view. It's built for analysts and business leads who need to present measurement results without drowning the audience in data. The deck supports competitive innovation analysis conversations as well as internal performance reviews. Useful whenever the question in the room is not just what happened, but whether it was enough. The template is 100% editable and customizable.
[product_image id=1682289]
Template 19: How to Measure Customer Satisfaction Effectively PPT Graphics
Customer satisfaction is one of the clearest signals that innovation is landing—or that it isn't. This PPT preset is built for CX leads and product managers who need to measure and present satisfaction data in a way that connects back to innovation decisions. The deck frames measurement as an ongoing practice, not a one-time survey, which matters for teams running continuous improvement programs. It's practical for both internal team reviews and external client reporting. The template is 100% editable and customizable.
[product_image id=1845374]
Elevate Your Innovation Reporting with SlideTeam
SlideTeam's PowerPoint templates are the best in the industry for presenting innovation metrics with clarity and confidence. These content-ready slides give you professional structure for everything from innovation dashboards to R&D productivity reviews—saving hours of formatting work. Use these ready-made PowerPoint slides to connect innovation activity to real business outcomes your leadership team can act on. Deploy these pre-designed templates today and make every innovation metric count.
FAQs on Innovation Metrics
How do you differentiate between leading and lagging indicators when measuring innovation performance?
Leading indicators predict future innovation output—think ideas in the pipeline, R&D hours invested, or experiments initiated. Lagging indicators confirm what already happened—revenue from new products, patents granted, or market share gained. Use leading indicators to course-correct early; use lagging ones to validate results. The key is tracking both in parallel, not choosing between them.
What metrics best capture the commercial viability of early-stage innovation projects?
For early-stage projects, focus on customer validation signals—pilot conversion rates, willingness-to-pay data, and time to first paying customer. These tell you whether an idea has real market pull, not just internal enthusiasm. R&D spend relative to validated learning is also useful. Avoid revenue as a primary metric at this stage; it's too early to be meaningful.
How can organizations measure the cultural factors that either accelerate or hinder innovation?
Culture is measurable through proxy behaviors. Track psychological safety scores via regular surveys, the ratio of ideas submitted versus ideas killed without review, and participation rates in cross-functional innovation programs. Time allocated to experimentation outside core job roles is another useful signal. These behaviors reveal whether culture is actually supporting innovation or just claiming to.
What is the relationship between R&D spending efficiency and actual innovation output?
More R&D spending does not automatically produce more innovation. What matters is the ratio of validated outputs—new products launched, patents filed, or revenue from new lines—relative to total R&D investment. Companies with leaner R&D productivity often outperform heavy spenders by focusing spend on validated problems rather than broad exploration.
How do you quantify the value of failed innovation experiments within a portfolio framework?
Failed experiments have value if they generate actionable learning. Quantify this by tracking cost per learning—total spend on the experiment divided by documented decisions it informed. A portfolio approach treats failures as tuition paid for validated direction changes. The metric to watch is whether failures are fast and cheap, not whether they are absent.
What role does time-to-market play as an innovation metric, and when does it become misleading?
Time-to-market measures speed from concept to commercial availability—useful for competitive positioning and resource planning. It becomes misleading when speed is prioritized over market readiness, resulting in launches that fail to gain traction. Pair it with post-launch adoption rate to get an honest picture. Speed without uptake is just fast failure.
How can companies measure incremental versus disruptive innovation differently within the same framework?
Incremental innovation is best measured by improvement margins—cost reduction, efficiency gains, or satisfaction score changes on existing products. Disruptive innovation needs different signals: new customer segments reached, markets created, or technology adoption rate among early adopters. Applying the same KPIs to both will make incremental work look stronger than it is and disruptive work look weaker.
What metrics should startups prioritize versus large enterprises when tracking innovation health?
Startups should prioritize speed and learning metrics—experiments run per quarter, time to first customer, and pivot frequency. Large enterprises need metrics tied to portfolio balance, R&D productivity, and innovation contribution to total revenue. Startups need to know if they're moving; enterprises need to know if their scale is actually producing proportionate output.


