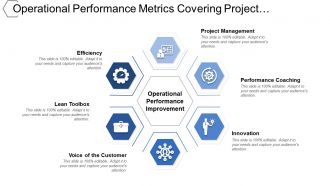
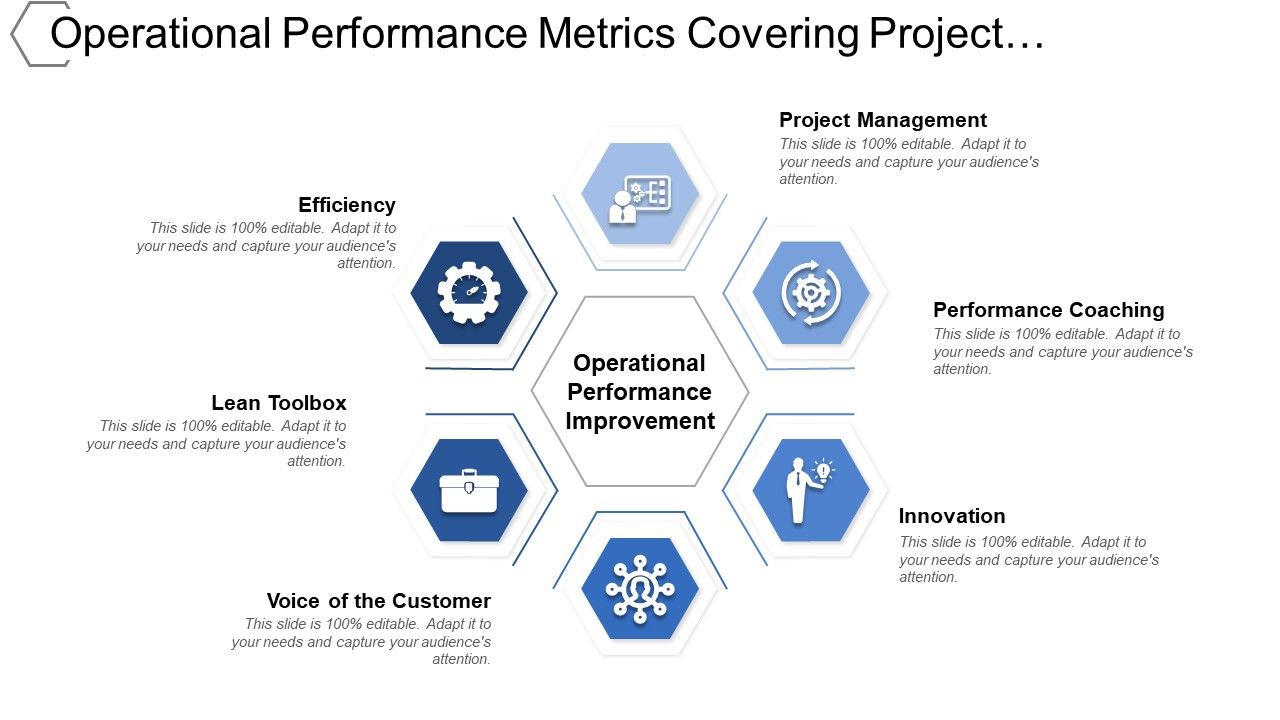
Operational performance metrics covering project management innovation
Try Before you Buy Download Free Sample Product
Audience
Editable
of Time
Avert accidents with our Operational Performance Metrics Covering Project Management Innovation. Ensure folks don't commit any errors.
People who downloaded this PowerPoint presentation also viewed the following :
Operational performance metrics covering project management innovation with all 5 slides:
Get the inefficient to function better with our Operational Performance Metrics Covering Project Management Innovation. Bring about a change of attitude.
FAQs for Operational performance metrics covering
Honestly, just focus on the big three buckets - efficiency stuff like cycle time and throughput, quality measures (defect rates, customer satisfaction), and the money side like cost per unit. Don't go crazy tracking everything though, that's how you end up drowning in spreadsheets! Pick maybe 5-7 metrics tops that actually connect to what you're trying to achieve. You want both the predictive stuff and the after-the-fact results. I learned this the hard way - started with like 20 different metrics and couldn't see the forest for the trees. Get these basics down solid first, then you can always add more later.
Look, it really depends on what industry you're in because each one cares about totally different stuff. Manufacturing obsesses over how fast they can pump out products and equipment uptime. Retail? They're all about inventory turnover and sales per square foot. Healthcare tracks patient wait times - which honestly makes sense when you think about it. Tech companies live and die by system availability and whether users actually engage with their platforms. Don't just copy what everyone else is measuring. Figure out what's actually breaking in your industry first, then build metrics around fixing those problems.
So KPIs are like your business dashboard - they turn all that chaotic daily stuff into numbers you can actually track. You'll spot problems way before they become disasters, which honestly saves so much stress. Pick ones that actually matter to your goals though, not just metrics that sound impressive in meetings. I'd start with maybe 3-5 that directly tie to what you're trying to achieve operationally. They're great for seeing patterns and comparing how you're doing over time. Don't go overboard with too many - you'll just overwhelm yourself with data.
Pick 3-5 metrics that actually matter for your goals - not just pretty numbers on a dashboard. Set clear baselines first, then track how things change over time. Here's the thing most teams mess up: they obsess over the data but never DO anything with it! You need specific thresholds that trigger real actions. Like, if conversion drops below X%, we immediately try Y solution. Then measure again to see if it worked. I'd start with just one process honestly - get that rhythm down before expanding. The whole measure-analyze-change-measure cycle is where real improvement happens, but you gotta close that loop.
Ugh, data silos are the worst - nothing connects properly so you're stuck copying stuff from like five different places. Teams measure things totally differently too, which makes everything a mess. Then there's the whole real-time vs batch data thing creating random gaps everywhere. Manual entry mistakes happen constantly (obviously), and legacy systems are just... why do they even exist? Oh, and timing issues will drive you crazy. Honestly though, start with getting everyone to agree on how you define your main metrics. That alone helps tons. Then maybe look into some decent integration tools.
Whatever metrics you pick will basically run your whole operation - teams optimize for what gets measured, period. Focus only on costs? You'll cut quality corners every time. I learned this the hard way at my last job tbh. Balance is key though - cost plus quality, speed, customer happiness gives you the real story. Bad metrics create weird behaviors where people game the system instead of actually improving things. Pick maybe 3-4 that align with your actual goals, not just whatever's easiest to track. Those become your north star for every decision.
You're basically flying blind without benchmarks, honestly. Like thinking your 2% conversion rate rocks until you find out everyone else is hitting 5% - ouch. Industry standards show you what "good" actually looks like vs just "good enough." Your executives will love seeing competitor comparisons too. Start with maybe 3-4 metrics that really matter to your business. Then hunt down some solid industry reports or peer networks for comparison data. It's the fastest way to spot gaps you didn't even know existed and figure out where to focus next.
Honestly, tech makes tracking metrics so much easier than doing everything manually. Start with automated data feeds - no more updating spreadsheets by hand (thank god). Real-time dashboards can pull info from all your different systems at once. IoT sensors are great for monitoring stuff continuously, and AI actually catches patterns you'd miss otherwise. Machine learning can even predict problems before they blow up, which saves your butt. I'd pick just one or two metrics that really matter to your team first. Once you see how much time it saves, you can add more from there.
Honestly, just pick 3-5 things that actually move the needle - customer acquisition cost, monthly revenue, inventory turnover, stuff like that. I'd avoid getting sucked into building some crazy dashboard right away (trust me, I've watched people burn weeks on that). Google Sheets works fine for now. Track consistently, that's what matters. Oh, and actually look at the numbers weekly or monthly - don't just collect data to feel productive. The metrics you pick should tie directly to revenue or keeping customers happy. Maybe start with just one metric this week? You'll get the hang of it pretty quick.
Dude, when operations go south, it's like watching dominoes fall. Customer satisfaction tanks first. Then your profit margins get squeezed while cash flow starts choking up. Your team gets demoralized (and honestly, who can blame them?). Meanwhile costs keep climbing because everything becomes firefighting mode. Customers bail, revenue drops, but you're still bleeding money on inefficiencies. What really gets me is how fast this stuff compounds - I've watched small hiccups turn into company-killing disasters. Watch your metrics closely and jump on problems early before they spiral.
Honestly, it depends what you're trying to figure out. I'd start with the hard numbers - response times, error rates, that stuff. Way easier to track consistently. But here's the thing: data without context is pretty useless. You need the human side too - surveys, team feedback, user complaints. I usually go like 70% quantitative, 30% qualitative, though some teams flip that ratio. The trick is connecting each metric to an actual decision you'll make. Otherwise you're just collecting numbers for no reason. Oh, and don't get stuck only measuring what's easy to measure.
Honestly, you've gotta make them feel like partners in this, not lab rats. I'd start by letting employees help define what metrics actually make sense for their jobs - sounds obvious but so many places skip this step. Show them how the data helps THEM get better, not just your boss's spreadsheet. Never go punitive right away though. Build some trust first. Give people access to their own numbers so they can track progress themselves. Oh, and definitely explain why you're measuring what you're measuring - connect it to goals they actually care about. I've watched this crash and burn when it's just dropped from corporate without context.
So operational metrics are basically like having x-ray vision into your business - you can see exactly where things are getting stuck or where you're burning money for no reason. Track stuff like how long processes take, throughput rates, and whether your teams are swamped or sitting around. Once you get into it, spotting these patterns becomes weirdly satisfying. The trick is being consistent about measuring the same things over time. Then when you see the data, you can move people or budget to whatever's gonna give you the biggest bang for your buck. Honestly just pick 3-4 metrics tied to your worst headaches and start there.
Start with your biggest insights, then throw in the numbers to back them up. Different people need different details - your boss wants the high-level stuff while team leads need the nitty-gritty. Honestly, getting people to actually READ your reports is like... good luck with that lol. Charts and dashboards help tons because nobody wants to dig through spreadsheets. Keep your format consistent so people know what they're getting. Oh, and don't just dump data on them - tell them what to DO about it. That's the part most people mess up.
Honestly, operational metrics are like having a crystal ball for your business. They catch problems way before they turn into disasters. Error rates going up? Resource bottlenecks forming? You'll see it coming. I always think of it as way better than those useless car warning lights that only go off when you're already screwed. Track stuff like throughput and cycle times - gives you actual data to work with instead of just putting out fires all day. Set up some alerts on the important stuff so you can fix things while they're still small problems.
-
Great designs, really helpful.
-
Content of slide is easy to understand and edit.